Immigrants from Thailand vs Immigrants from India Male Disability
COMPARE
Immigrants from Thailand
Immigrants from India
Male Disability
Male Disability Comparison
Immigrants from Thailand
Immigrants from India
11.6%
MALE DISABILITY
8.4/ 100
METRIC RATING
211th/ 347
METRIC RANK
9.0%
MALE DISABILITY
100.0/ 100
METRIC RATING
1st/ 347
METRIC RANK
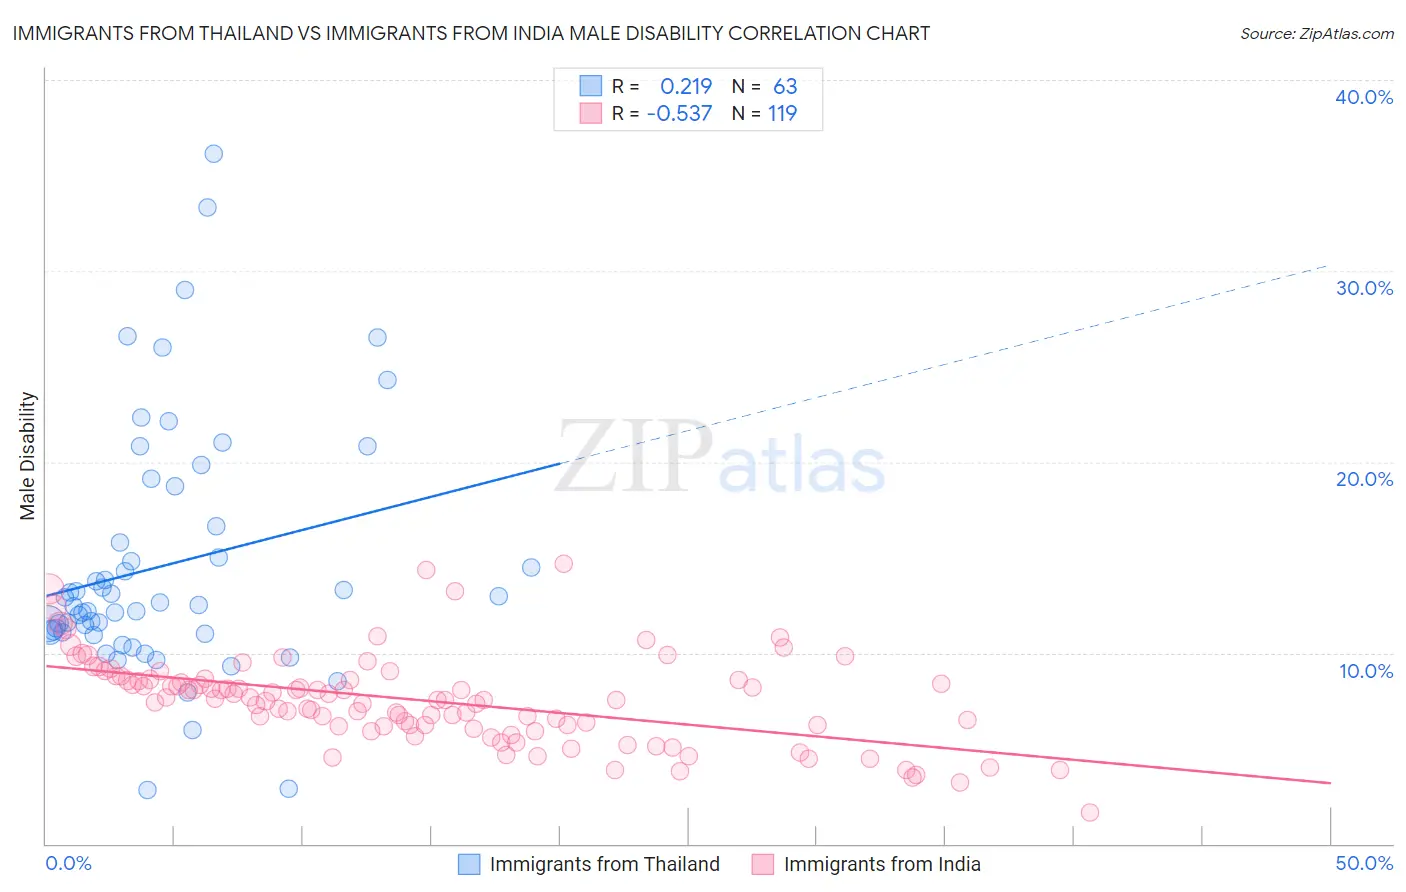
Immigrants from Thailand vs Immigrants from India Male Disability Correlation Chart
The statistical analysis conducted on geographies consisting of 316,976,914 people shows a weak positive correlation between the proportion of Immigrants from Thailand and percentage of males with a disability in the United States with a correlation coefficient (R) of 0.219 and weighted average of 11.6%. Similarly, the statistical analysis conducted on geographies consisting of 434,062,130 people shows a substantial negative correlation between the proportion of Immigrants from India and percentage of males with a disability in the United States with a correlation coefficient (R) of -0.537 and weighted average of 9.0%, a difference of 28.3%.
Male Disability Correlation Summary
| Measurement | Immigrants from Thailand | Immigrants from India |
| Minimum | 2.8% | 1.6% |
| Maximum | 36.2% | 14.7% |
| Range | 33.3% | 13.0% |
| Mean | 14.6% | 7.5% |
| Median | 12.5% | 7.6% |
| Interquartile 25% (IQ1) | 11.1% | 6.2% |
| Interquartile 75% (IQ3) | 16.6% | 8.6% |
| Interquartile Range (IQR) | 5.6% | 2.5% |
| Standard Deviation (Sample) | 6.5% | 2.3% |
| Standard Deviation (Population) | 6.5% | 2.3% |
Similar Demographics by Male Disability
Demographics Similar to Immigrants from Thailand by Male Disability
In terms of male disability, the demographic groups most similar to Immigrants from Thailand are Immigrants from Scotland (11.6%, a difference of 0.030%), Mexican American Indian (11.6%, a difference of 0.10%), Ute (11.6%, a difference of 0.17%), Spanish American Indian (11.6%, a difference of 0.27%), and Icelander (11.6%, a difference of 0.28%).
| Demographics | Rating | Rank | Male Disability |
| Immigrants | Cambodia | 10.8 /100 | #204 | Poor 11.5% |
| Serbians | 10.7 /100 | #205 | Poor 11.5% |
| Ukrainians | 10.6 /100 | #206 | Poor 11.5% |
| Immigrants | Somalia | 10.4 /100 | #207 | Poor 11.5% |
| Icelanders | 10.1 /100 | #208 | Poor 11.6% |
| Spanish American Indians | 10.1 /100 | #209 | Poor 11.6% |
| Ute | 9.4 /100 | #210 | Tragic 11.6% |
| Immigrants | Thailand | 8.4 /100 | #211 | Tragic 11.6% |
| Immigrants | Scotland | 8.2 /100 | #212 | Tragic 11.6% |
| Mexican American Indians | 7.8 /100 | #213 | Tragic 11.6% |
| Lithuanians | 6.6 /100 | #214 | Tragic 11.6% |
| Indonesians | 5.9 /100 | #215 | Tragic 11.6% |
| Immigrants | Dominican Republic | 4.9 /100 | #216 | Tragic 11.7% |
| Immigrants | Dominica | 4.6 /100 | #217 | Tragic 11.7% |
| Immigrants | England | 4.0 /100 | #218 | Tragic 11.7% |
Demographics Similar to Immigrants from India by Male Disability
In terms of male disability, the demographic groups most similar to Immigrants from India are Immigrants from Taiwan (9.1%, a difference of 0.89%), Filipino (9.1%, a difference of 0.90%), Thai (9.2%, a difference of 2.2%), Immigrants from Hong Kong (9.4%, a difference of 4.4%), and Immigrants from South Central Asia (9.4%, a difference of 4.4%).
| Demographics | Rating | Rank | Male Disability |
| Immigrants | India | 100.0 /100 | #1 | Exceptional 9.0% |
| Immigrants | Taiwan | 100.0 /100 | #2 | Exceptional 9.1% |
| Filipinos | 100.0 /100 | #3 | Exceptional 9.1% |
| Thais | 100.0 /100 | #4 | Exceptional 9.2% |
| Immigrants | Hong Kong | 100.0 /100 | #5 | Exceptional 9.4% |
| Immigrants | South Central Asia | 100.0 /100 | #6 | Exceptional 9.4% |
| Immigrants | Bolivia | 100.0 /100 | #7 | Exceptional 9.5% |
| Immigrants | China | 100.0 /100 | #8 | Exceptional 9.5% |
| Immigrants | Singapore | 100.0 /100 | #9 | Exceptional 9.5% |
| Immigrants | Israel | 100.0 /100 | #10 | Exceptional 9.6% |
| Immigrants | Eastern Asia | 100.0 /100 | #11 | Exceptional 9.6% |
| Bolivians | 100.0 /100 | #12 | Exceptional 9.6% |
| Iranians | 100.0 /100 | #13 | Exceptional 9.7% |
| Immigrants | Iran | 100.0 /100 | #14 | Exceptional 9.7% |
| Indians (Asian) | 100.0 /100 | #15 | Exceptional 9.7% |