Immigrants from Thailand vs English Female Unemployment
COMPARE
Immigrants from Thailand
English
Female Unemployment
Female Unemployment Comparison
Immigrants from Thailand
English
5.2%
FEMALE UNEMPLOYMENT
62.1/ 100
METRIC RATING
167th/ 347
METRIC RANK
4.6%
FEMALE UNEMPLOYMENT
100.0/ 100
METRIC RATING
15th/ 347
METRIC RANK
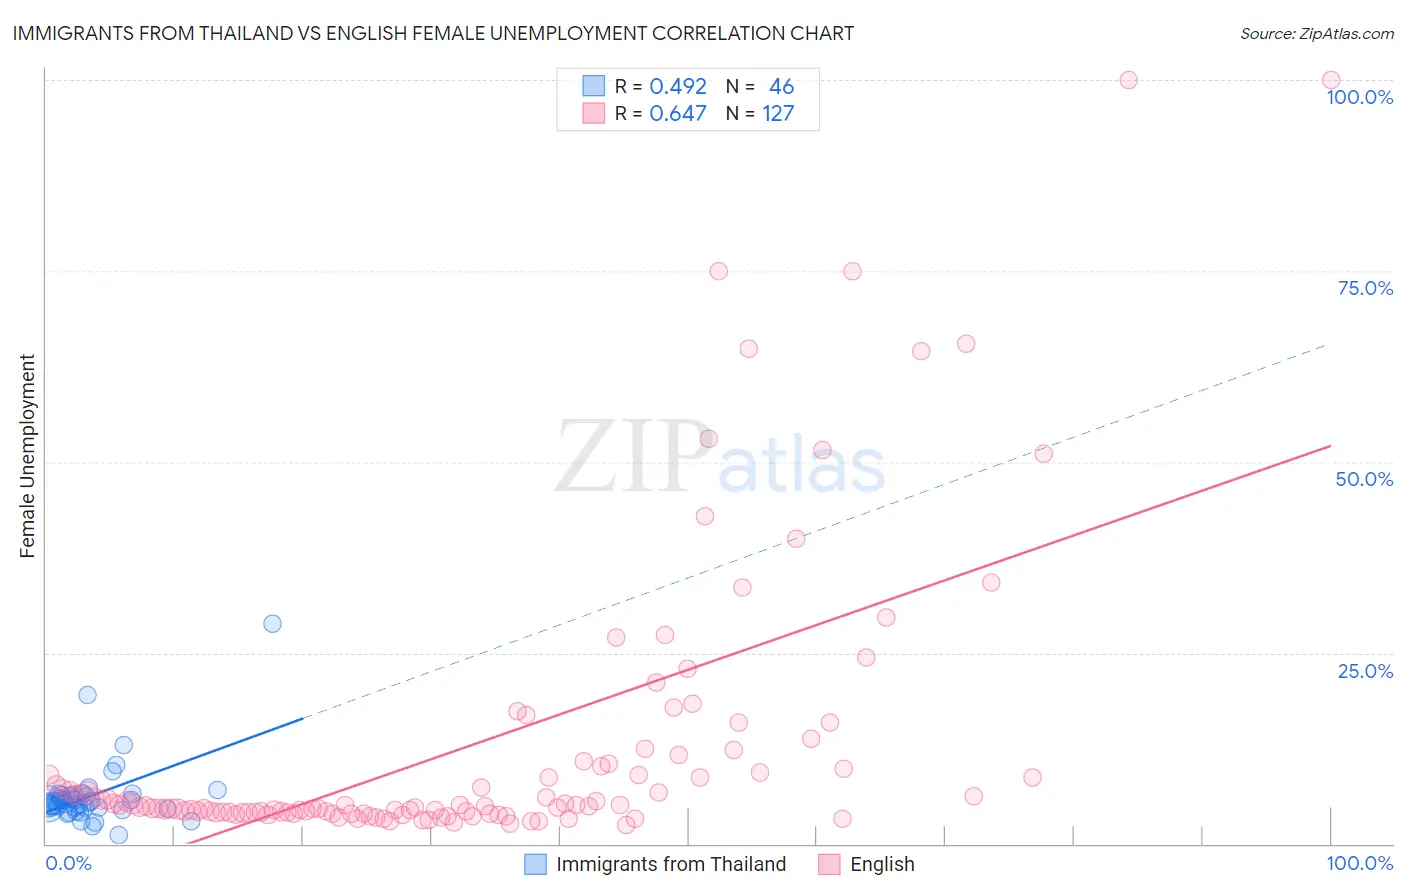
Immigrants from Thailand vs English Female Unemployment Correlation Chart
The statistical analysis conducted on geographies consisting of 316,285,605 people shows a moderate positive correlation between the proportion of Immigrants from Thailand and unemploymnet rate among females in the United States with a correlation coefficient (R) of 0.492 and weighted average of 5.2%. Similarly, the statistical analysis conducted on geographies consisting of 563,002,519 people shows a significant positive correlation between the proportion of English and unemploymnet rate among females in the United States with a correlation coefficient (R) of 0.647 and weighted average of 4.6%, a difference of 12.6%.
Female Unemployment Correlation Summary
| Measurement | Immigrants from Thailand | English |
| Minimum | 1.2% | 2.5% |
| Maximum | 28.8% | 100.0% |
| Range | 27.6% | 97.5% |
| Mean | 6.3% | 12.9% |
| Median | 5.5% | 5.0% |
| Interquartile 25% (IQ1) | 4.8% | 4.1% |
| Interquartile 75% (IQ3) | 6.4% | 10.5% |
| Interquartile Range (IQR) | 1.7% | 6.4% |
| Standard Deviation (Sample) | 4.4% | 19.0% |
| Standard Deviation (Population) | 4.4% | 18.9% |
Similar Demographics by Female Unemployment
Demographics Similar to Immigrants from Thailand by Female Unemployment
In terms of female unemployment, the demographic groups most similar to Immigrants from Thailand are Syrian (5.2%, a difference of 0.040%), Native Hawaiian (5.2%, a difference of 0.040%), Immigrants from Asia (5.2%, a difference of 0.14%), Bangladeshi (5.2%, a difference of 0.14%), and Sri Lankan (5.2%, a difference of 0.17%).
| Demographics | Rating | Rank | Female Unemployment |
| Immigrants | Spain | 66.8 /100 | #160 | Good 5.2% |
| Immigrants | Pakistan | 66.7 /100 | #161 | Good 5.2% |
| Potawatomi | 65.9 /100 | #162 | Good 5.2% |
| Immigrants | Asia | 64.3 /100 | #163 | Good 5.2% |
| Bangladeshis | 64.3 /100 | #164 | Good 5.2% |
| Syrians | 62.8 /100 | #165 | Good 5.2% |
| Native Hawaiians | 62.7 /100 | #166 | Good 5.2% |
| Immigrants | Thailand | 62.1 /100 | #167 | Good 5.2% |
| Sri Lankans | 59.4 /100 | #168 | Average 5.2% |
| Immigrants | Chile | 59.0 /100 | #169 | Average 5.2% |
| Spanish | 55.9 /100 | #170 | Average 5.2% |
| Immigrants | Denmark | 55.0 /100 | #171 | Average 5.2% |
| Immigrants | Uganda | 50.7 /100 | #172 | Average 5.3% |
| Iranians | 50.4 /100 | #173 | Average 5.3% |
| Immigrants | Poland | 50.0 /100 | #174 | Average 5.3% |
Demographics Similar to English by Female Unemployment
In terms of female unemployment, the demographic groups most similar to English are Finnish (4.6%, a difference of 0.20%), Belgian (4.6%, a difference of 0.79%), Carpatho Rusyn (4.7%, a difference of 0.85%), Croatian (4.7%, a difference of 0.87%), and Dutch (4.6%, a difference of 0.94%).
| Demographics | Rating | Rank | Female Unemployment |
| Germans | 100.0 /100 | #8 | Exceptional 4.5% |
| Slovenes | 100.0 /100 | #9 | Exceptional 4.5% |
| Swiss | 100.0 /100 | #10 | Exceptional 4.6% |
| Scandinavians | 100.0 /100 | #11 | Exceptional 4.6% |
| Dutch | 100.0 /100 | #12 | Exceptional 4.6% |
| Belgians | 100.0 /100 | #13 | Exceptional 4.6% |
| Finns | 100.0 /100 | #14 | Exceptional 4.6% |
| English | 100.0 /100 | #15 | Exceptional 4.6% |
| Carpatho Rusyns | 99.9 /100 | #16 | Exceptional 4.7% |
| Croatians | 99.9 /100 | #17 | Exceptional 4.7% |
| Latvians | 99.9 /100 | #18 | Exceptional 4.7% |
| Poles | 99.9 /100 | #19 | Exceptional 4.7% |
| Bulgarians | 99.9 /100 | #20 | Exceptional 4.7% |
| Fijians | 99.9 /100 | #21 | Exceptional 4.7% |
| Europeans | 99.9 /100 | #22 | Exceptional 4.7% |