Greek vs Celtic Disability Age 35 to 64
COMPARE
Greek
Celtic
Disability Age 35 to 64
Disability Age 35 to 64 Comparison
Greeks
Celtics
10.7%
DISABILITY AGE 35 TO 64
92.3/ 100
METRIC RATING
135th/ 347
METRIC RANK
12.9%
DISABILITY AGE 35 TO 64
0.1/ 100
METRIC RATING
274th/ 347
METRIC RANK
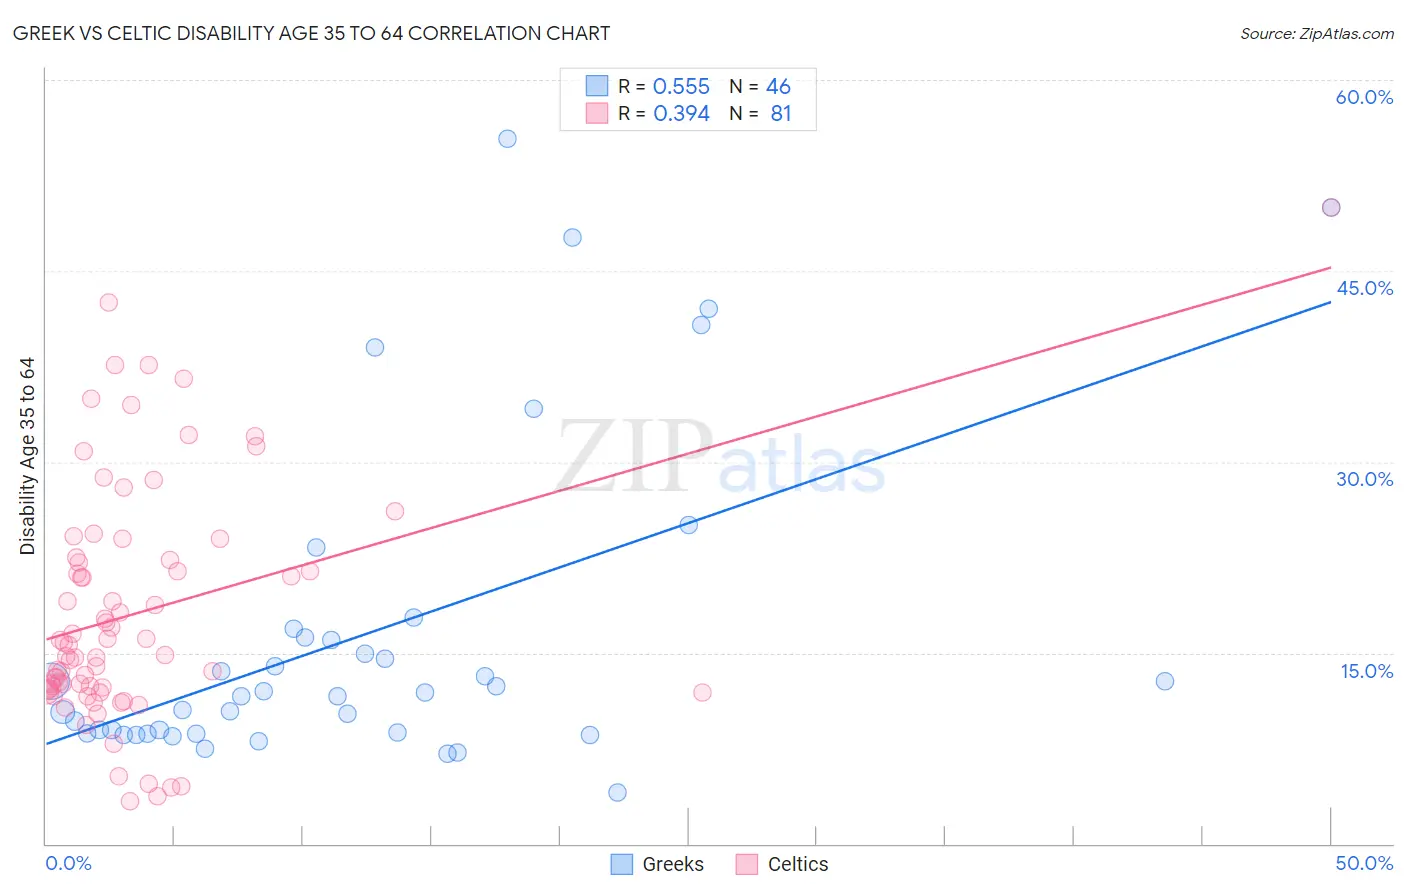
Greek vs Celtic Disability Age 35 to 64 Correlation Chart
The statistical analysis conducted on geographies consisting of 482,222,080 people shows a substantial positive correlation between the proportion of Greeks and percentage of population with a disability between the ages 34 and 64 in the United States with a correlation coefficient (R) of 0.555 and weighted average of 10.7%. Similarly, the statistical analysis conducted on geographies consisting of 168,843,567 people shows a mild positive correlation between the proportion of Celtics and percentage of population with a disability between the ages 34 and 64 in the United States with a correlation coefficient (R) of 0.394 and weighted average of 12.9%, a difference of 20.0%.
Disability Age 35 to 64 Correlation Summary
| Measurement | Greek | Celtic |
| Minimum | 4.0% | 3.4% |
| Maximum | 55.4% | 50.0% |
| Range | 51.4% | 46.6% |
| Mean | 16.5% | 18.2% |
| Median | 11.8% | 15.6% |
| Interquartile 25% (IQ1) | 8.7% | 12.1% |
| Interquartile 75% (IQ3) | 16.2% | 22.4% |
| Interquartile Range (IQR) | 7.5% | 10.3% |
| Standard Deviation (Sample) | 12.7% | 9.4% |
| Standard Deviation (Population) | 12.6% | 9.3% |
Similar Demographics by Disability Age 35 to 64
Demographics Similar to Greeks by Disability Age 35 to 64
In terms of disability age 35 to 64, the demographic groups most similar to Greeks are Immigrants from Albania (10.7%, a difference of 0.050%), Immigrants (10.7%, a difference of 0.050%), Immigrants from Ecuador (10.7%, a difference of 0.050%), Salvadoran (10.7%, a difference of 0.11%), and Immigrants from El Salvador (10.7%, a difference of 0.16%).
| Demographics | Rating | Rank | Disability Age 35 to 64 |
| South Africans | 93.3 /100 | #128 | Exceptional 10.7% |
| Ecuadorians | 93.1 /100 | #129 | Exceptional 10.7% |
| Immigrants | Syria | 93.0 /100 | #130 | Exceptional 10.7% |
| Immigrants | El Salvador | 92.8 /100 | #131 | Exceptional 10.7% |
| Immigrants | Albania | 92.5 /100 | #132 | Exceptional 10.7% |
| Immigrants | Immigrants | 92.5 /100 | #133 | Exceptional 10.7% |
| Immigrants | Ecuador | 92.5 /100 | #134 | Exceptional 10.7% |
| Greeks | 92.3 /100 | #135 | Exceptional 10.7% |
| Salvadorans | 91.9 /100 | #136 | Exceptional 10.7% |
| Immigrants | Costa Rica | 91.7 /100 | #137 | Exceptional 10.7% |
| Immigrants | Southern Europe | 91.5 /100 | #138 | Exceptional 10.7% |
| Costa Ricans | 91.4 /100 | #139 | Exceptional 10.7% |
| Immigrants | Scotland | 91.3 /100 | #140 | Exceptional 10.7% |
| Australians | 90.7 /100 | #141 | Exceptional 10.8% |
| Immigrants | Saudi Arabia | 90.6 /100 | #142 | Exceptional 10.8% |
Demographics Similar to Celtics by Disability Age 35 to 64
In terms of disability age 35 to 64, the demographic groups most similar to Celtics are Pennsylvania German (12.8%, a difference of 0.030%), U.S. Virgin Islander (12.8%, a difference of 0.11%), Dominican (12.9%, a difference of 0.14%), Nepalese (12.8%, a difference of 0.23%), and Somali (12.9%, a difference of 0.26%).
| Demographics | Rating | Rank | Disability Age 35 to 64 |
| Sub-Saharan Africans | 0.2 /100 | #267 | Tragic 12.6% |
| Immigrants | Dominica | 0.2 /100 | #268 | Tragic 12.7% |
| Spanish | 0.2 /100 | #269 | Tragic 12.7% |
| French | 0.2 /100 | #270 | Tragic 12.7% |
| Nepalese | 0.1 /100 | #271 | Tragic 12.8% |
| U.S. Virgin Islanders | 0.1 /100 | #272 | Tragic 12.8% |
| Pennsylvania Germans | 0.1 /100 | #273 | Tragic 12.8% |
| Celtics | 0.1 /100 | #274 | Tragic 12.9% |
| Dominicans | 0.1 /100 | #275 | Tragic 12.9% |
| Somalis | 0.1 /100 | #276 | Tragic 12.9% |
| Immigrants | Dominican Republic | 0.1 /100 | #277 | Tragic 12.9% |
| French Canadians | 0.1 /100 | #278 | Tragic 12.9% |
| Immigrants | Micronesia | 0.1 /100 | #279 | Tragic 12.9% |
| Liberians | 0.1 /100 | #280 | Tragic 12.9% |
| Scotch-Irish | 0.1 /100 | #281 | Tragic 13.0% |