Immigrants from Syria vs Cambodian Disability Age Under 5
COMPARE
Immigrants from Syria
Cambodian
Disability Age Under 5
Disability Age Under 5 Comparison
Immigrants from Syria
Cambodians
1.1%
DISABILITY AGE UNDER 5
97.9/ 100
METRIC RATING
83rd/ 347
METRIC RANK
1.2%
DISABILITY AGE UNDER 5
95.4/ 100
METRIC RATING
106th/ 347
METRIC RANK
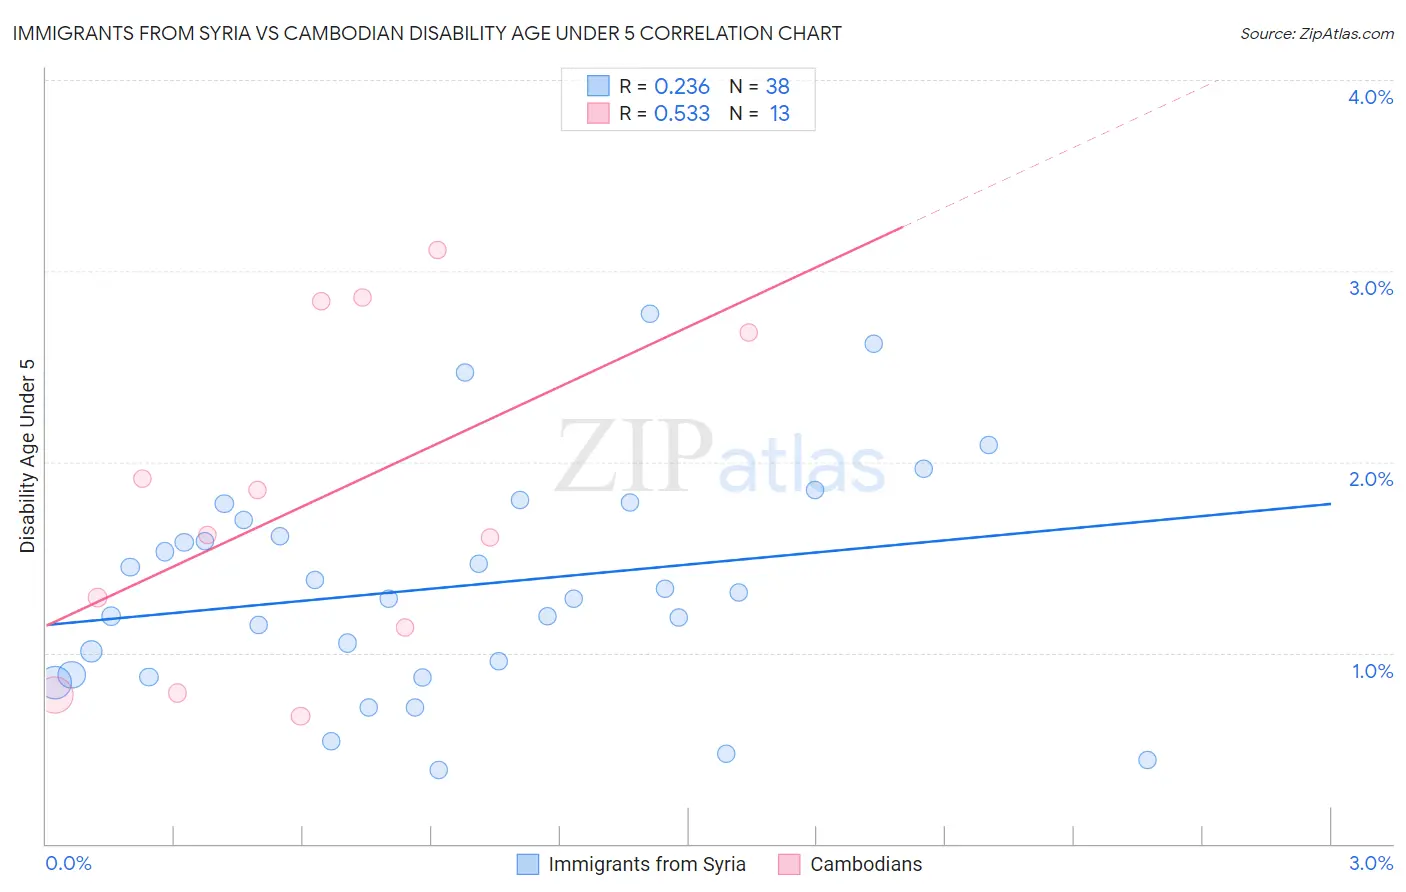
Immigrants from Syria vs Cambodian Disability Age Under 5 Correlation Chart
The statistical analysis conducted on geographies consisting of 121,605,651 people shows a weak positive correlation between the proportion of Immigrants from Syria and percentage of population with a disability under the age of 5 in the United States with a correlation coefficient (R) of 0.236 and weighted average of 1.1%. Similarly, the statistical analysis conducted on geographies consisting of 77,498,292 people shows a substantial positive correlation between the proportion of Cambodians and percentage of population with a disability under the age of 5 in the United States with a correlation coefficient (R) of 0.533 and weighted average of 1.2%, a difference of 2.0%.
Disability Age Under 5 Correlation Summary
| Measurement | Immigrants from Syria | Cambodian |
| Minimum | 0.39% | 0.67% |
| Maximum | 2.8% | 3.1% |
| Range | 2.4% | 2.4% |
| Mean | 1.3% | 1.8% |
| Median | 1.3% | 1.6% |
| Interquartile 25% (IQ1) | 0.88% | 0.96% |
| Interquartile 75% (IQ3) | 1.7% | 2.8% |
| Interquartile Range (IQR) | 0.81% | 1.8% |
| Standard Deviation (Sample) | 0.58% | 0.86% |
| Standard Deviation (Population) | 0.57% | 0.82% |
Similar Demographics by Disability Age Under 5
Demographics Similar to Immigrants from Syria by Disability Age Under 5
In terms of disability age under 5, the demographic groups most similar to Immigrants from Syria are Immigrants from Jordan (1.1%, a difference of 0.010%), Turkish (1.1%, a difference of 0.12%), Immigrants from Trinidad and Tobago (1.1%, a difference of 0.14%), Immigrants from Zaire (1.1%, a difference of 0.15%), and Hmong (1.1%, a difference of 0.16%).
| Demographics | Rating | Rank | Disability Age Under 5 |
| Immigrants | Burma/Myanmar | 98.2 /100 | #76 | Exceptional 1.1% |
| Immigrants | Denmark | 98.1 /100 | #77 | Exceptional 1.1% |
| West Indians | 98.0 /100 | #78 | Exceptional 1.1% |
| Hmong | 98.0 /100 | #79 | Exceptional 1.1% |
| Immigrants | Trinidad and Tobago | 98.0 /100 | #80 | Exceptional 1.1% |
| Turks | 98.0 /100 | #81 | Exceptional 1.1% |
| Immigrants | Jordan | 97.9 /100 | #82 | Exceptional 1.1% |
| Immigrants | Syria | 97.9 /100 | #83 | Exceptional 1.1% |
| Immigrants | Zaire | 97.8 /100 | #84 | Exceptional 1.1% |
| Sudanese | 97.7 /100 | #85 | Exceptional 1.1% |
| Okinawans | 97.6 /100 | #86 | Exceptional 1.1% |
| Ugandans | 97.5 /100 | #87 | Exceptional 1.1% |
| Immigrants | Dominican Republic | 97.5 /100 | #88 | Exceptional 1.1% |
| Ethiopians | 97.2 /100 | #89 | Exceptional 1.1% |
| Chinese | 97.2 /100 | #90 | Exceptional 1.1% |
Demographics Similar to Cambodians by Disability Age Under 5
In terms of disability age under 5, the demographic groups most similar to Cambodians are Immigrants from West Indies (1.2%, a difference of 0.040%), Immigrants from South Africa (1.2%, a difference of 0.10%), Iraqi (1.2%, a difference of 0.17%), Immigrants from Panama (1.2%, a difference of 0.19%), and Immigrants from Lebanon (1.2%, a difference of 0.21%).
| Demographics | Rating | Rank | Disability Age Under 5 |
| Dominicans | 96.3 /100 | #99 | Exceptional 1.1% |
| Nicaraguans | 96.3 /100 | #100 | Exceptional 1.1% |
| Immigrants | Uganda | 96.1 /100 | #101 | Exceptional 1.1% |
| Immigrants | Morocco | 96.0 /100 | #102 | Exceptional 1.2% |
| Immigrants | Nicaragua | 96.0 /100 | #103 | Exceptional 1.2% |
| Indonesians | 95.9 /100 | #104 | Exceptional 1.2% |
| Immigrants | South Africa | 95.6 /100 | #105 | Exceptional 1.2% |
| Cambodians | 95.4 /100 | #106 | Exceptional 1.2% |
| Immigrants | West Indies | 95.3 /100 | #107 | Exceptional 1.2% |
| Iraqis | 95.1 /100 | #108 | Exceptional 1.2% |
| Immigrants | Panama | 95.0 /100 | #109 | Exceptional 1.2% |
| Immigrants | Lebanon | 95.0 /100 | #110 | Exceptional 1.2% |
| Senegalese | 94.6 /100 | #111 | Exceptional 1.2% |
| Immigrants | Australia | 94.4 /100 | #112 | Exceptional 1.2% |
| Immigrants | Oceania | 94.2 /100 | #113 | Exceptional 1.2% |