Chickasaw vs Cambodian Disability Age Under 5
COMPARE
Chickasaw
Cambodian
Disability Age Under 5
Disability Age Under 5 Comparison
Chickasaw
Cambodians
1.7%
DISABILITY AGE UNDER 5
0.0/ 100
METRIC RATING
323rd/ 347
METRIC RANK
1.2%
DISABILITY AGE UNDER 5
95.4/ 100
METRIC RATING
106th/ 347
METRIC RANK
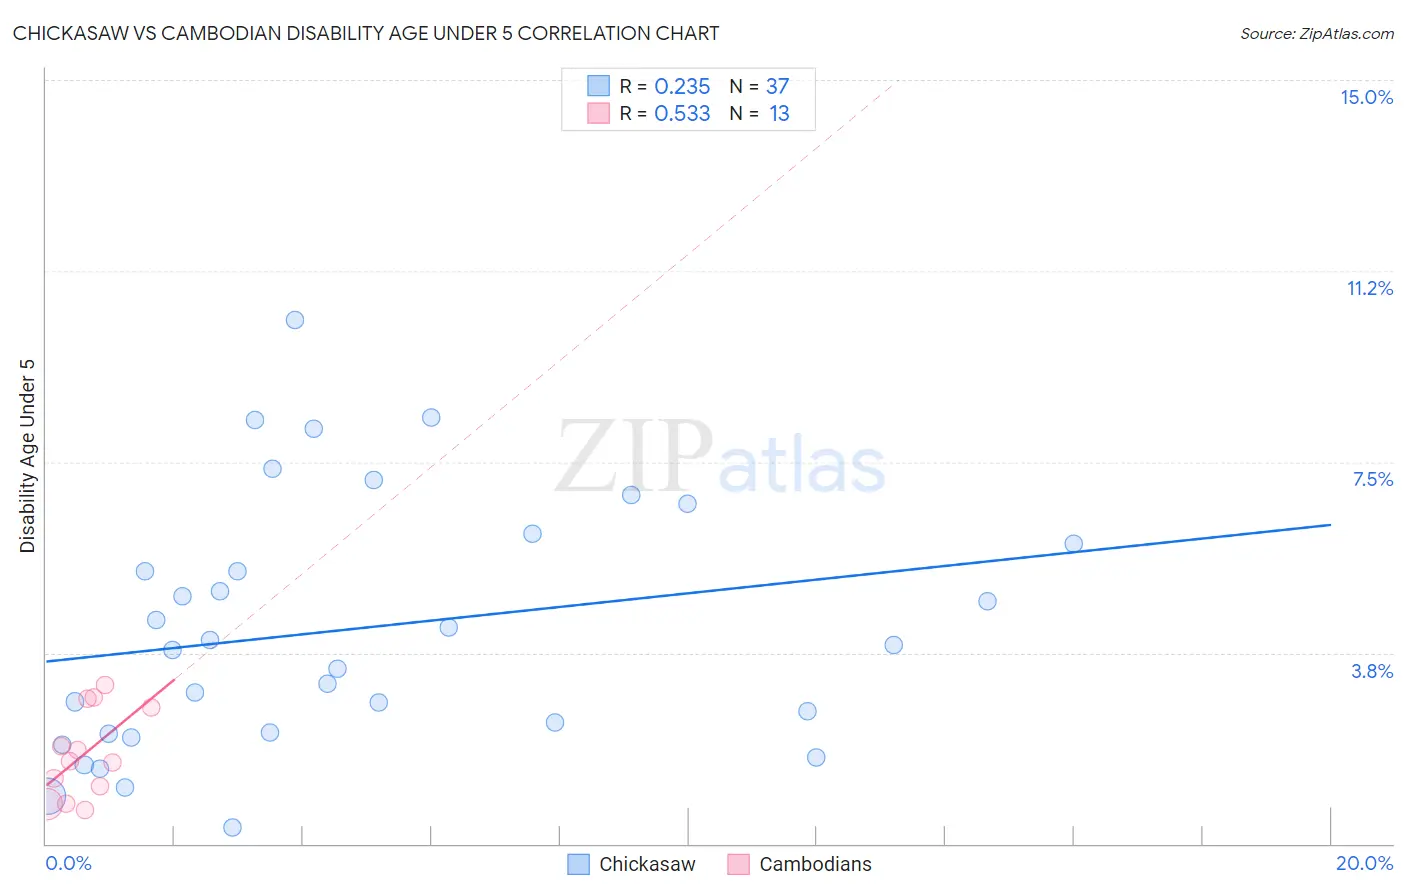
Chickasaw vs Cambodian Disability Age Under 5 Correlation Chart
The statistical analysis conducted on geographies consisting of 108,085,172 people shows a weak positive correlation between the proportion of Chickasaw and percentage of population with a disability under the age of 5 in the United States with a correlation coefficient (R) of 0.235 and weighted average of 1.7%. Similarly, the statistical analysis conducted on geographies consisting of 77,498,292 people shows a substantial positive correlation between the proportion of Cambodians and percentage of population with a disability under the age of 5 in the United States with a correlation coefficient (R) of 0.533 and weighted average of 1.2%, a difference of 50.7%.
Disability Age Under 5 Correlation Summary
| Measurement | Chickasaw | Cambodian |
| Minimum | 0.31% | 0.67% |
| Maximum | 10.3% | 3.1% |
| Range | 10.0% | 2.4% |
| Mean | 4.2% | 1.8% |
| Median | 3.9% | 1.6% |
| Interquartile 25% (IQ1) | 2.2% | 0.96% |
| Interquartile 75% (IQ3) | 6.0% | 2.8% |
| Interquartile Range (IQR) | 3.8% | 1.8% |
| Standard Deviation (Sample) | 2.5% | 0.86% |
| Standard Deviation (Population) | 2.4% | 0.82% |
Similar Demographics by Disability Age Under 5
Demographics Similar to Chickasaw by Disability Age Under 5
In terms of disability age under 5, the demographic groups most similar to Chickasaw are German (1.7%, a difference of 1.1%), Ottawa (1.7%, a difference of 1.7%), Scotch-Irish (1.7%, a difference of 1.8%), Cherokee (1.8%, a difference of 1.8%), and Slovak (1.7%, a difference of 2.3%).
| Demographics | Rating | Rank | Disability Age Under 5 |
| Immigrants | Cabo Verde | 0.0 /100 | #316 | Tragic 1.7% |
| French | 0.0 /100 | #317 | Tragic 1.7% |
| Irish | 0.0 /100 | #318 | Tragic 1.7% |
| Slovaks | 0.0 /100 | #319 | Tragic 1.7% |
| Scotch-Irish | 0.0 /100 | #320 | Tragic 1.7% |
| Ottawa | 0.0 /100 | #321 | Tragic 1.7% |
| Germans | 0.0 /100 | #322 | Tragic 1.7% |
| Chickasaw | 0.0 /100 | #323 | Tragic 1.7% |
| Cherokee | 0.0 /100 | #324 | Tragic 1.8% |
| Immigrants | Portugal | 0.0 /100 | #325 | Tragic 1.8% |
| Sioux | 0.0 /100 | #326 | Tragic 1.8% |
| Osage | 0.0 /100 | #327 | Tragic 1.8% |
| Americans | 0.0 /100 | #328 | Tragic 1.9% |
| Houma | 0.0 /100 | #329 | Tragic 1.9% |
| Choctaw | 0.0 /100 | #330 | Tragic 1.9% |
Demographics Similar to Cambodians by Disability Age Under 5
In terms of disability age under 5, the demographic groups most similar to Cambodians are Immigrants from West Indies (1.2%, a difference of 0.040%), Immigrants from South Africa (1.2%, a difference of 0.10%), Iraqi (1.2%, a difference of 0.17%), Immigrants from Panama (1.2%, a difference of 0.19%), and Immigrants from Lebanon (1.2%, a difference of 0.21%).
| Demographics | Rating | Rank | Disability Age Under 5 |
| Dominicans | 96.3 /100 | #99 | Exceptional 1.1% |
| Nicaraguans | 96.3 /100 | #100 | Exceptional 1.1% |
| Immigrants | Uganda | 96.1 /100 | #101 | Exceptional 1.1% |
| Immigrants | Morocco | 96.0 /100 | #102 | Exceptional 1.2% |
| Immigrants | Nicaragua | 96.0 /100 | #103 | Exceptional 1.2% |
| Indonesians | 95.9 /100 | #104 | Exceptional 1.2% |
| Immigrants | South Africa | 95.6 /100 | #105 | Exceptional 1.2% |
| Cambodians | 95.4 /100 | #106 | Exceptional 1.2% |
| Immigrants | West Indies | 95.3 /100 | #107 | Exceptional 1.2% |
| Iraqis | 95.1 /100 | #108 | Exceptional 1.2% |
| Immigrants | Panama | 95.0 /100 | #109 | Exceptional 1.2% |
| Immigrants | Lebanon | 95.0 /100 | #110 | Exceptional 1.2% |
| Senegalese | 94.6 /100 | #111 | Exceptional 1.2% |
| Immigrants | Australia | 94.4 /100 | #112 | Exceptional 1.2% |
| Immigrants | Oceania | 94.2 /100 | #113 | Exceptional 1.2% |