Immigrants from Sweden vs Marshallese Female Disability
COMPARE
Immigrants from Sweden
Marshallese
Female Disability
Female Disability Comparison
Immigrants from Sweden
Marshallese
11.3%
FEMALE DISABILITY
100.0/ 100
METRIC RATING
45th/ 347
METRIC RANK
13.3%
FEMALE DISABILITY
0.0/ 100
METRIC RATING
293rd/ 347
METRIC RANK
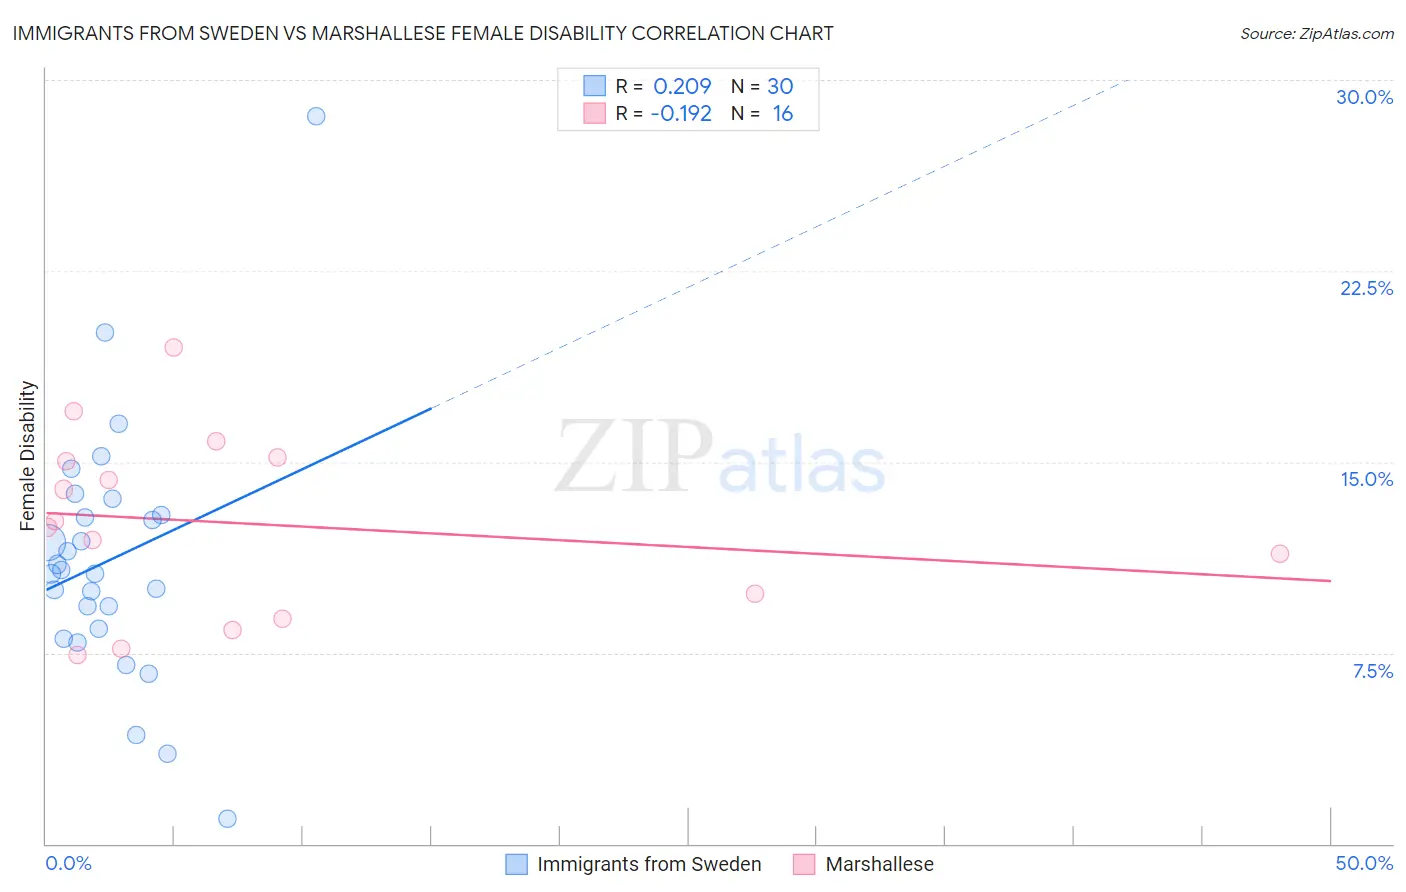
Immigrants from Sweden vs Marshallese Female Disability Correlation Chart
The statistical analysis conducted on geographies consisting of 164,745,093 people shows a weak positive correlation between the proportion of Immigrants from Sweden and percentage of females with a disability in the United States with a correlation coefficient (R) of 0.209 and weighted average of 11.3%. Similarly, the statistical analysis conducted on geographies consisting of 14,761,315 people shows a poor negative correlation between the proportion of Marshallese and percentage of females with a disability in the United States with a correlation coefficient (R) of -0.192 and weighted average of 13.3%, a difference of 17.8%.
Female Disability Correlation Summary
| Measurement | Immigrants from Sweden | Marshallese |
| Minimum | 0.98% | 7.4% |
| Maximum | 28.6% | 19.5% |
| Range | 27.6% | 12.1% |
| Mean | 11.2% | 12.6% |
| Median | 10.7% | 12.5% |
| Interquartile 25% (IQ1) | 8.5% | 9.3% |
| Interquartile 75% (IQ3) | 12.9% | 15.1% |
| Interquartile Range (IQR) | 4.4% | 5.8% |
| Standard Deviation (Sample) | 5.1% | 3.5% |
| Standard Deviation (Population) | 5.0% | 3.4% |
Similar Demographics by Female Disability
Demographics Similar to Immigrants from Sweden by Female Disability
In terms of female disability, the demographic groups most similar to Immigrants from Sweden are Cambodian (11.3%, a difference of 0.040%), Immigrants from Nepal (11.3%, a difference of 0.050%), Jordanian (11.3%, a difference of 0.060%), Zimbabwean (11.3%, a difference of 0.070%), and Tongan (11.3%, a difference of 0.080%).
| Demographics | Rating | Rank | Female Disability |
| Immigrants | Ethiopia | 100.0 /100 | #38 | Exceptional 11.2% |
| Immigrants | Lithuania | 100.0 /100 | #39 | Exceptional 11.2% |
| Mongolians | 100.0 /100 | #40 | Exceptional 11.2% |
| Paraguayans | 100.0 /100 | #41 | Exceptional 11.2% |
| Israelis | 100.0 /100 | #42 | Exceptional 11.2% |
| Afghans | 100.0 /100 | #43 | Exceptional 11.2% |
| Cambodians | 100.0 /100 | #44 | Exceptional 11.3% |
| Immigrants | Sweden | 100.0 /100 | #45 | Exceptional 11.3% |
| Immigrants | Nepal | 100.0 /100 | #46 | Exceptional 11.3% |
| Jordanians | 100.0 /100 | #47 | Exceptional 11.3% |
| Zimbabweans | 100.0 /100 | #48 | Exceptional 11.3% |
| Tongans | 100.0 /100 | #49 | Exceptional 11.3% |
| Inupiat | 100.0 /100 | #50 | Exceptional 11.3% |
| Immigrants | Belgium | 100.0 /100 | #51 | Exceptional 11.3% |
| Immigrants | Peru | 99.9 /100 | #52 | Exceptional 11.3% |
Demographics Similar to Marshallese by Female Disability
In terms of female disability, the demographic groups most similar to Marshallese are Celtic (13.3%, a difference of 0.050%), Yakama (13.2%, a difference of 0.26%), French (13.3%, a difference of 0.26%), Nepalese (13.3%, a difference of 0.39%), and Slovak (13.3%, a difference of 0.42%).
| Demographics | Rating | Rank | Female Disability |
| Fijians | 0.0 /100 | #286 | Tragic 13.1% |
| Yaqui | 0.0 /100 | #287 | Tragic 13.2% |
| Whites/Caucasians | 0.0 /100 | #288 | Tragic 13.2% |
| Tlingit-Haida | 0.0 /100 | #289 | Tragic 13.2% |
| Immigrants | Yemen | 0.0 /100 | #290 | Tragic 13.2% |
| Shoshone | 0.0 /100 | #291 | Tragic 13.2% |
| Yakama | 0.0 /100 | #292 | Tragic 13.2% |
| Marshallese | 0.0 /100 | #293 | Tragic 13.3% |
| Celtics | 0.0 /100 | #294 | Tragic 13.3% |
| French | 0.0 /100 | #295 | Tragic 13.3% |
| Nepalese | 0.0 /100 | #296 | Tragic 13.3% |
| Slovaks | 0.0 /100 | #297 | Tragic 13.3% |
| Immigrants | Nonimmigrants | 0.0 /100 | #298 | Tragic 13.4% |
| Immigrants | Dominican Republic | 0.0 /100 | #299 | Tragic 13.4% |
| Pennsylvania Germans | 0.0 /100 | #300 | Tragic 13.4% |