Immigrants from Netherlands vs Marshallese Female Disability
COMPARE
Immigrants from Netherlands
Marshallese
Female Disability
Female Disability Comparison
Immigrants from Netherlands
Marshallese
11.8%
FEMALE DISABILITY
96.9/ 100
METRIC RATING
121st/ 347
METRIC RANK
13.3%
FEMALE DISABILITY
0.0/ 100
METRIC RATING
293rd/ 347
METRIC RANK
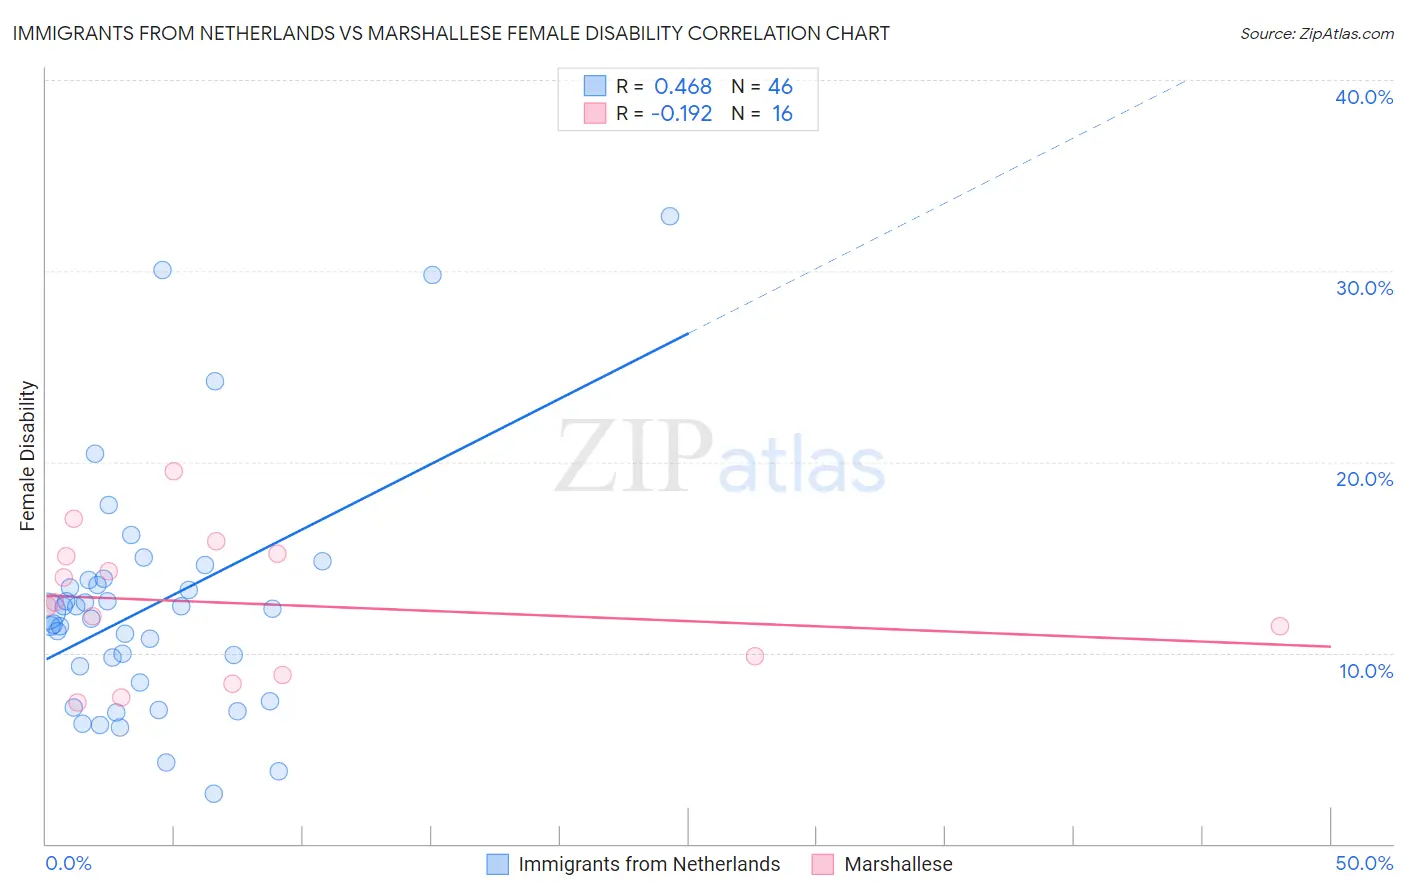
Immigrants from Netherlands vs Marshallese Female Disability Correlation Chart
The statistical analysis conducted on geographies consisting of 237,879,368 people shows a moderate positive correlation between the proportion of Immigrants from Netherlands and percentage of females with a disability in the United States with a correlation coefficient (R) of 0.468 and weighted average of 11.8%. Similarly, the statistical analysis conducted on geographies consisting of 14,761,315 people shows a poor negative correlation between the proportion of Marshallese and percentage of females with a disability in the United States with a correlation coefficient (R) of -0.192 and weighted average of 13.3%, a difference of 12.5%.
Female Disability Correlation Summary
| Measurement | Immigrants from Netherlands | Marshallese |
| Minimum | 2.6% | 7.4% |
| Maximum | 32.9% | 19.5% |
| Range | 30.2% | 12.1% |
| Mean | 12.5% | 12.6% |
| Median | 12.0% | 12.5% |
| Interquartile 25% (IQ1) | 8.4% | 9.3% |
| Interquartile 75% (IQ3) | 13.8% | 15.1% |
| Interquartile Range (IQR) | 5.4% | 5.8% |
| Standard Deviation (Sample) | 6.4% | 3.5% |
| Standard Deviation (Population) | 6.3% | 3.4% |
Similar Demographics by Female Disability
Demographics Similar to Immigrants from Netherlands by Female Disability
In terms of female disability, the demographic groups most similar to Immigrants from Netherlands are Immigrants from North Macedonia (11.8%, a difference of 0.010%), Immigrants from Kazakhstan (11.8%, a difference of 0.030%), Immigrants from Croatia (11.8%, a difference of 0.060%), Immigrants from Eastern Europe (11.8%, a difference of 0.11%), and Immigrants from Nigeria (11.8%, a difference of 0.11%).
| Demographics | Rating | Rank | Female Disability |
| South Africans | 97.7 /100 | #114 | Exceptional 11.8% |
| Brazilians | 97.7 /100 | #115 | Exceptional 11.8% |
| Immigrants | Morocco | 97.6 /100 | #116 | Exceptional 11.8% |
| Immigrants | Eastern Europe | 97.2 /100 | #117 | Exceptional 11.8% |
| Immigrants | Nigeria | 97.2 /100 | #118 | Exceptional 11.8% |
| Immigrants | Uganda | 97.2 /100 | #119 | Exceptional 11.8% |
| Immigrants | Kazakhstan | 97.0 /100 | #120 | Exceptional 11.8% |
| Immigrants | Netherlands | 96.9 /100 | #121 | Exceptional 11.8% |
| Immigrants | North Macedonia | 96.8 /100 | #122 | Exceptional 11.8% |
| Immigrants | Croatia | 96.7 /100 | #123 | Exceptional 11.8% |
| Russians | 96.5 /100 | #124 | Exceptional 11.8% |
| Immigrants | Italy | 96.4 /100 | #125 | Exceptional 11.8% |
| Immigrants | Europe | 96.2 /100 | #126 | Exceptional 11.8% |
| South American Indians | 95.8 /100 | #127 | Exceptional 11.8% |
| Immigrants | Latvia | 95.6 /100 | #128 | Exceptional 11.8% |
Demographics Similar to Marshallese by Female Disability
In terms of female disability, the demographic groups most similar to Marshallese are Celtic (13.3%, a difference of 0.050%), Yakama (13.2%, a difference of 0.26%), French (13.3%, a difference of 0.26%), Nepalese (13.3%, a difference of 0.39%), and Slovak (13.3%, a difference of 0.42%).
| Demographics | Rating | Rank | Female Disability |
| Fijians | 0.0 /100 | #286 | Tragic 13.1% |
| Yaqui | 0.0 /100 | #287 | Tragic 13.2% |
| Whites/Caucasians | 0.0 /100 | #288 | Tragic 13.2% |
| Tlingit-Haida | 0.0 /100 | #289 | Tragic 13.2% |
| Immigrants | Yemen | 0.0 /100 | #290 | Tragic 13.2% |
| Shoshone | 0.0 /100 | #291 | Tragic 13.2% |
| Yakama | 0.0 /100 | #292 | Tragic 13.2% |
| Marshallese | 0.0 /100 | #293 | Tragic 13.3% |
| Celtics | 0.0 /100 | #294 | Tragic 13.3% |
| French | 0.0 /100 | #295 | Tragic 13.3% |
| Nepalese | 0.0 /100 | #296 | Tragic 13.3% |
| Slovaks | 0.0 /100 | #297 | Tragic 13.3% |
| Immigrants | Nonimmigrants | 0.0 /100 | #298 | Tragic 13.4% |
| Immigrants | Dominican Republic | 0.0 /100 | #299 | Tragic 13.4% |
| Pennsylvania Germans | 0.0 /100 | #300 | Tragic 13.4% |