Immigrants from Belgium vs Paiute Disability Age 65 to 74
COMPARE
Immigrants from Belgium
Paiute
Disability Age 65 to 74
Disability Age 65 to 74 Comparison
Immigrants from Belgium
Paiute
21.0%
DISABILITY AGE 65 TO 74
99.9/ 100
METRIC RATING
23rd/ 347
METRIC RANK
27.8%
DISABILITY AGE 65 TO 74
0.0/ 100
METRIC RATING
313th/ 347
METRIC RANK
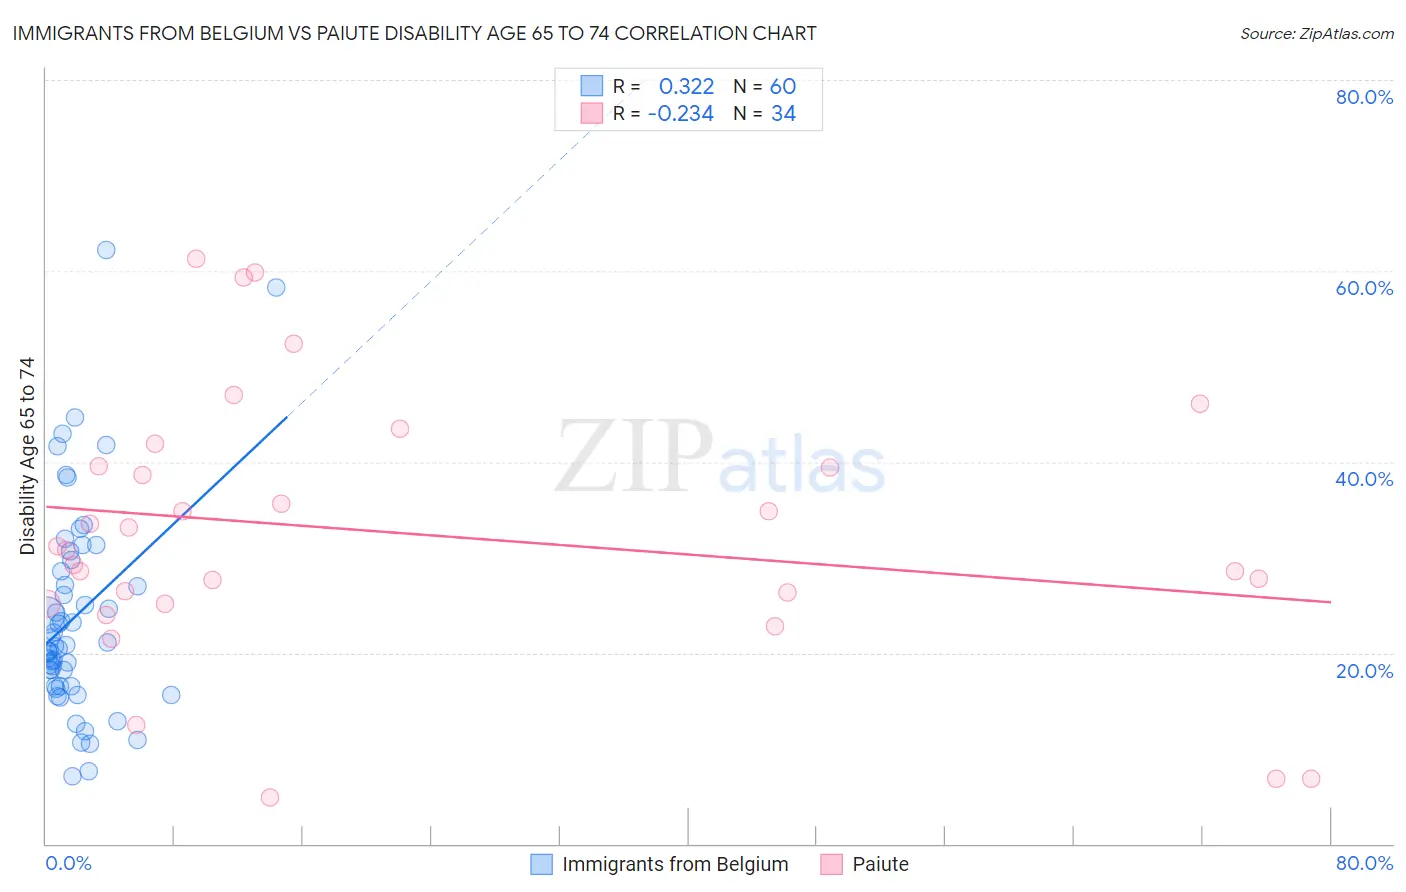
Immigrants from Belgium vs Paiute Disability Age 65 to 74 Correlation Chart
The statistical analysis conducted on geographies consisting of 146,630,596 people shows a mild positive correlation between the proportion of Immigrants from Belgium and percentage of population with a disability between the ages 65 and 75 in the United States with a correlation coefficient (R) of 0.322 and weighted average of 21.0%. Similarly, the statistical analysis conducted on geographies consisting of 58,387,848 people shows a weak negative correlation between the proportion of Paiute and percentage of population with a disability between the ages 65 and 75 in the United States with a correlation coefficient (R) of -0.234 and weighted average of 27.8%, a difference of 32.7%.
Disability Age 65 to 74 Correlation Summary
| Measurement | Immigrants from Belgium | Paiute |
| Minimum | 7.0% | 4.8% |
| Maximum | 62.2% | 61.3% |
| Range | 55.2% | 56.4% |
| Mean | 23.9% | 32.6% |
| Median | 20.7% | 31.0% |
| Interquartile 25% (IQ1) | 16.6% | 25.2% |
| Interquartile 75% (IQ3) | 29.1% | 39.5% |
| Interquartile Range (IQR) | 12.6% | 14.3% |
| Standard Deviation (Sample) | 11.1% | 14.0% |
| Standard Deviation (Population) | 11.0% | 13.8% |
Similar Demographics by Disability Age 65 to 74
Demographics Similar to Immigrants from Belgium by Disability Age 65 to 74
In terms of disability age 65 to 74, the demographic groups most similar to Immigrants from Belgium are Soviet Union (21.0%, a difference of 0.050%), Bolivian (21.0%, a difference of 0.090%), Immigrants from Australia (21.0%, a difference of 0.11%), Immigrants from Sweden (21.0%, a difference of 0.12%), and Immigrants from Czechoslovakia (21.0%, a difference of 0.22%).
| Demographics | Rating | Rank | Disability Age 65 to 74 |
| Immigrants | Lithuania | 100.0 /100 | #16 | Exceptional 20.5% |
| Immigrants | South Central Asia | 100.0 /100 | #17 | Exceptional 20.6% |
| Eastern Europeans | 100.0 /100 | #18 | Exceptional 20.6% |
| Burmese | 100.0 /100 | #19 | Exceptional 20.6% |
| Okinawans | 100.0 /100 | #20 | Exceptional 20.7% |
| Immigrants | Bolivia | 99.9 /100 | #21 | Exceptional 20.8% |
| Immigrants | Iran | 99.9 /100 | #22 | Exceptional 20.9% |
| Immigrants | Belgium | 99.9 /100 | #23 | Exceptional 21.0% |
| Soviet Union | 99.9 /100 | #24 | Exceptional 21.0% |
| Bolivians | 99.9 /100 | #25 | Exceptional 21.0% |
| Immigrants | Australia | 99.9 /100 | #26 | Exceptional 21.0% |
| Immigrants | Sweden | 99.9 /100 | #27 | Exceptional 21.0% |
| Immigrants | Czechoslovakia | 99.9 /100 | #28 | Exceptional 21.0% |
| Immigrants | Japan | 99.9 /100 | #29 | Exceptional 21.0% |
| Immigrants | Greece | 99.9 /100 | #30 | Exceptional 21.0% |
Demographics Similar to Paiute by Disability Age 65 to 74
In terms of disability age 65 to 74, the demographic groups most similar to Paiute are Chippewa (27.8%, a difference of 0.010%), Cajun (27.9%, a difference of 0.48%), Crow (27.9%, a difference of 0.53%), Immigrants from Armenia (28.0%, a difference of 0.62%), and Nepalese (28.0%, a difference of 0.84%).
| Demographics | Rating | Rank | Disability Age 65 to 74 |
| Blacks/African Americans | 0.0 /100 | #306 | Tragic 27.3% |
| Ute | 0.0 /100 | #307 | Tragic 27.3% |
| Sioux | 0.0 /100 | #308 | Tragic 27.3% |
| Yaqui | 0.0 /100 | #309 | Tragic 27.4% |
| Shoshone | 0.0 /100 | #310 | Tragic 27.4% |
| Menominee | 0.0 /100 | #311 | Tragic 27.4% |
| Osage | 0.0 /100 | #312 | Tragic 27.5% |
| Paiute | 0.0 /100 | #313 | Tragic 27.8% |
| Chippewa | 0.0 /100 | #314 | Tragic 27.8% |
| Cajuns | 0.0 /100 | #315 | Tragic 27.9% |
| Crow | 0.0 /100 | #316 | Tragic 27.9% |
| Immigrants | Armenia | 0.0 /100 | #317 | Tragic 28.0% |
| Nepalese | 0.0 /100 | #318 | Tragic 28.0% |
| Arapaho | 0.0 /100 | #319 | Tragic 28.1% |
| Cherokee | 0.0 /100 | #320 | Tragic 28.2% |