Scottish vs Immigrants from Jamaica Disability Age 65 to 74
COMPARE
Scottish
Immigrants from Jamaica
Disability Age 65 to 74
Disability Age 65 to 74 Comparison
Scottish
Immigrants from Jamaica
23.6%
DISABILITY AGE 65 TO 74
33.1/ 100
METRIC RATING
189th/ 347
METRIC RANK
23.8%
DISABILITY AGE 65 TO 74
20.7/ 100
METRIC RATING
206th/ 347
METRIC RANK
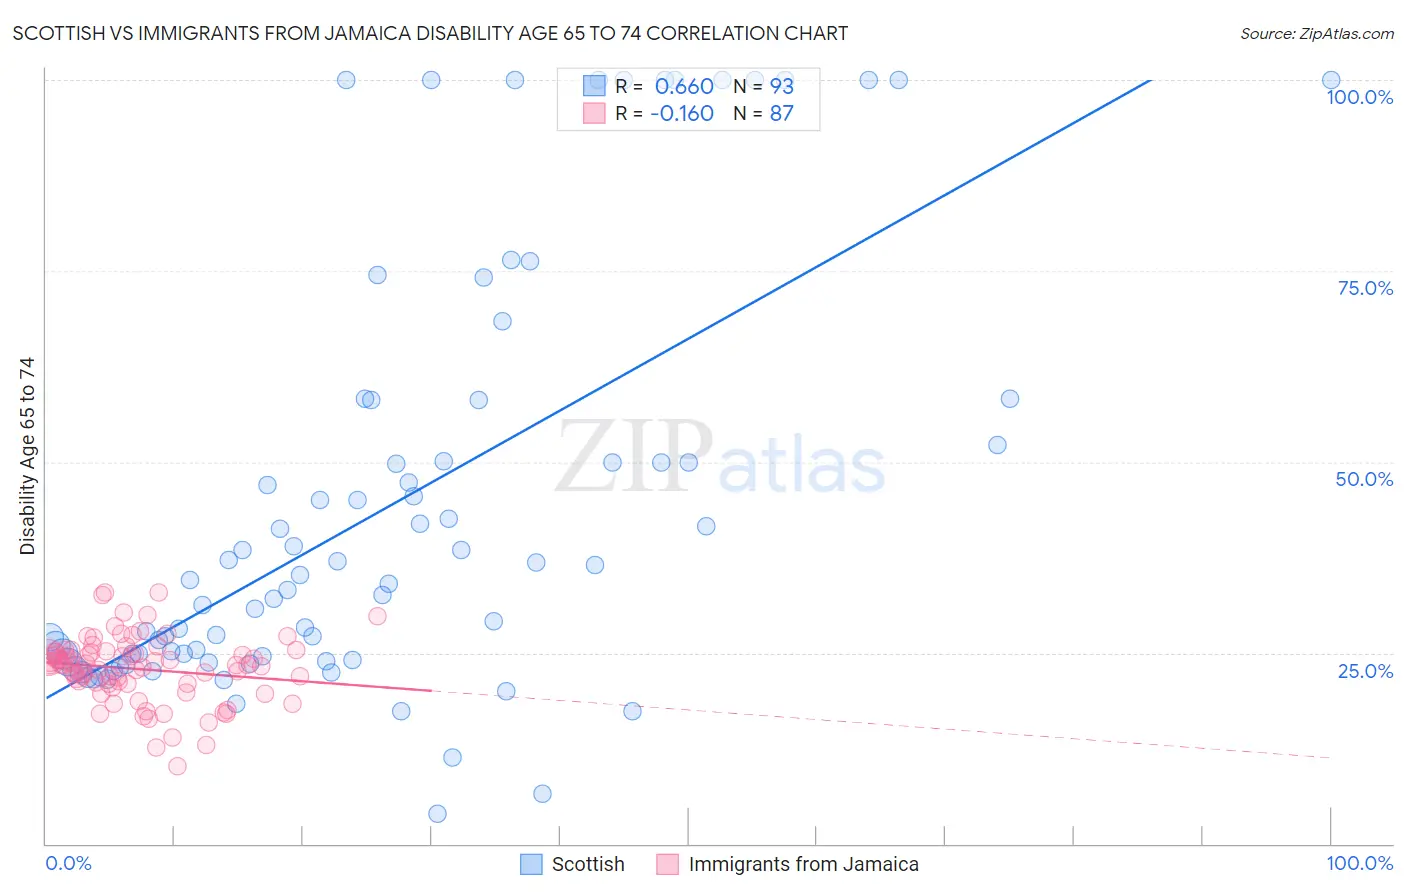
Scottish vs Immigrants from Jamaica Disability Age 65 to 74 Correlation Chart
The statistical analysis conducted on geographies consisting of 564,724,008 people shows a significant positive correlation between the proportion of Scottish and percentage of population with a disability between the ages 65 and 75 in the United States with a correlation coefficient (R) of 0.660 and weighted average of 23.6%. Similarly, the statistical analysis conducted on geographies consisting of 301,108,871 people shows a poor negative correlation between the proportion of Immigrants from Jamaica and percentage of population with a disability between the ages 65 and 75 in the United States with a correlation coefficient (R) of -0.160 and weighted average of 23.8%, a difference of 0.92%.
Disability Age 65 to 74 Correlation Summary
| Measurement | Scottish | Immigrants from Jamaica |
| Minimum | 4.0% | 10.1% |
| Maximum | 100.0% | 32.9% |
| Range | 96.0% | 22.8% |
| Mean | 43.7% | 22.9% |
| Median | 34.0% | 23.5% |
| Interquartile 25% (IQ1) | 24.0% | 20.9% |
| Interquartile 75% (IQ3) | 51.1% | 25.1% |
| Interquartile Range (IQR) | 27.1% | 4.1% |
| Standard Deviation (Sample) | 27.1% | 4.3% |
| Standard Deviation (Population) | 26.9% | 4.3% |
Demographics Similar to Scottish and Immigrants from Jamaica by Disability Age 65 to 74
In terms of disability age 65 to 74, the demographic groups most similar to Scottish are Immigrants from Cuba (23.6%, a difference of 0.060%), Immigrants from Guyana (23.6%, a difference of 0.12%), Immigrants from Bangladesh (23.6%, a difference of 0.19%), Ecuadorian (23.6%, a difference of 0.23%), and Portuguese (23.5%, a difference of 0.30%). Similarly, the demographic groups most similar to Immigrants from Jamaica are Tongan (23.8%, a difference of 0.0%), Immigrants from Sudan (23.8%, a difference of 0.060%), Immigrants from Grenada (23.8%, a difference of 0.11%), Kenyan (23.7%, a difference of 0.20%), and Immigrants from Bahamas (23.7%, a difference of 0.22%).
| Demographics | Rating | Rank | Disability Age 65 to 74 |
| Portuguese | 37.8 /100 | #187 | Fair 23.5% |
| Immigrants | Cuba | 34.0 /100 | #188 | Fair 23.6% |
| Scottish | 33.1 /100 | #189 | Fair 23.6% |
| Immigrants | Guyana | 31.2 /100 | #190 | Fair 23.6% |
| Immigrants | Bangladesh | 30.2 /100 | #191 | Fair 23.6% |
| Ecuadorians | 29.7 /100 | #192 | Fair 23.6% |
| English | 28.5 /100 | #193 | Fair 23.6% |
| Sudanese | 27.8 /100 | #194 | Fair 23.7% |
| Immigrants | St. Vincent and the Grenadines | 26.1 /100 | #195 | Fair 23.7% |
| Immigrants | Trinidad and Tobago | 26.1 /100 | #196 | Fair 23.7% |
| Immigrants | Immigrants | 25.8 /100 | #197 | Fair 23.7% |
| Immigrants | Africa | 24.4 /100 | #198 | Fair 23.7% |
| Welsh | 24.3 /100 | #199 | Fair 23.7% |
| French Canadians | 24.0 /100 | #200 | Fair 23.7% |
| Immigrants | Ecuador | 23.9 /100 | #201 | Fair 23.7% |
| Immigrants | Bahamas | 23.3 /100 | #202 | Fair 23.7% |
| Kenyans | 23.2 /100 | #203 | Fair 23.7% |
| Immigrants | Grenada | 22.1 /100 | #204 | Fair 23.8% |
| Tongans | 20.8 /100 | #205 | Fair 23.8% |
| Immigrants | Jamaica | 20.7 /100 | #206 | Fair 23.8% |
| Immigrants | Sudan | 20.1 /100 | #207 | Fair 23.8% |