Immigrants from Sri Lanka vs Bahamian Female Disability
COMPARE
Immigrants from Sri Lanka
Bahamian
Female Disability
Female Disability Comparison
Immigrants from Sri Lanka
Bahamians
10.9%
FEMALE DISABILITY
100.0/ 100
METRIC RATING
22nd/ 347
METRIC RANK
12.4%
FEMALE DISABILITY
11.1/ 100
METRIC RATING
220th/ 347
METRIC RANK
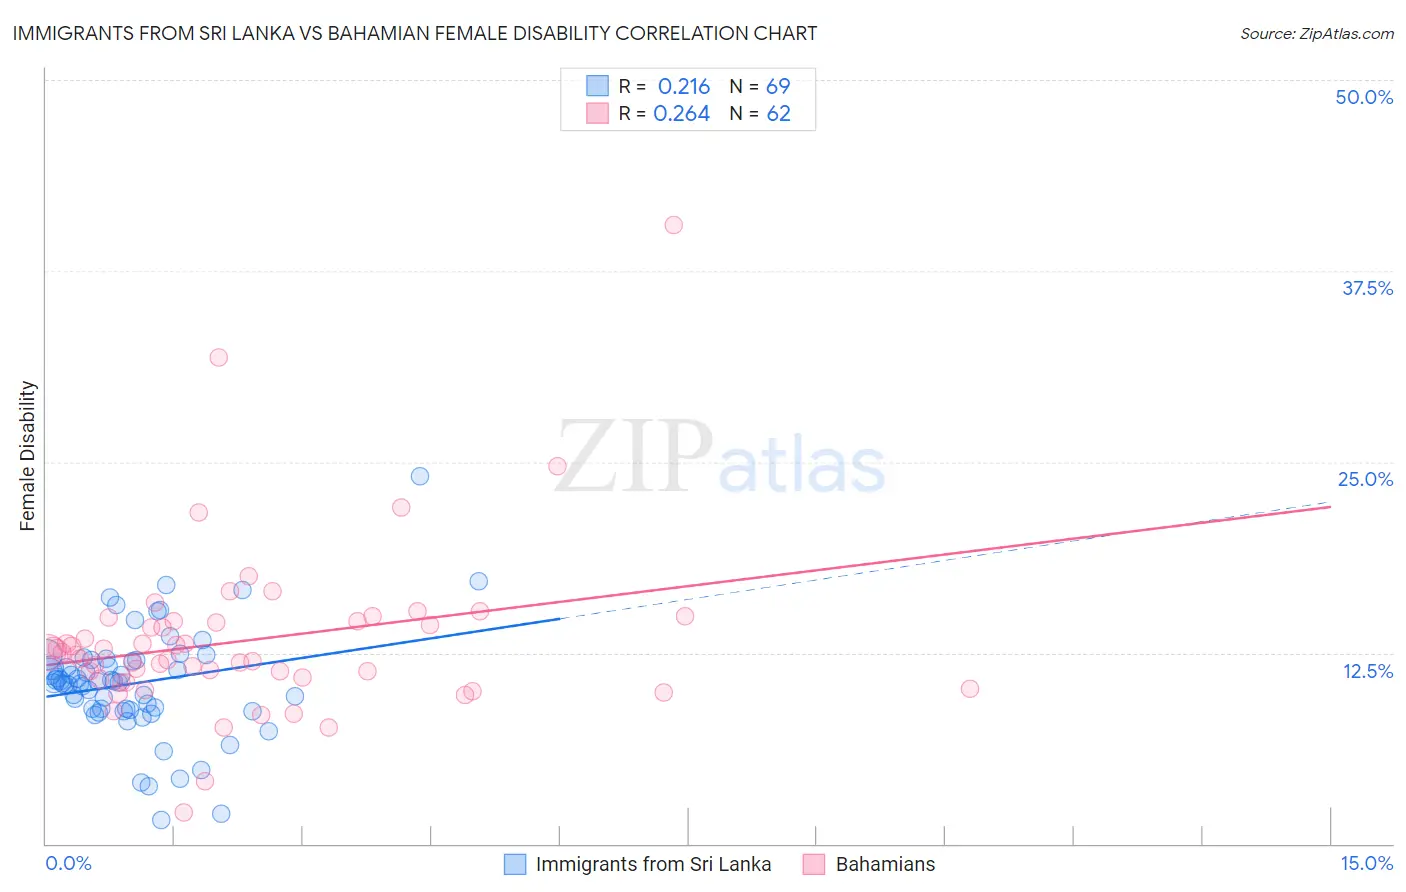
Immigrants from Sri Lanka vs Bahamian Female Disability Correlation Chart
The statistical analysis conducted on geographies consisting of 149,700,552 people shows a weak positive correlation between the proportion of Immigrants from Sri Lanka and percentage of females with a disability in the United States with a correlation coefficient (R) of 0.216 and weighted average of 10.9%. Similarly, the statistical analysis conducted on geographies consisting of 112,675,688 people shows a weak positive correlation between the proportion of Bahamians and percentage of females with a disability in the United States with a correlation coefficient (R) of 0.264 and weighted average of 12.4%, a difference of 13.8%.
Female Disability Correlation Summary
| Measurement | Immigrants from Sri Lanka | Bahamian |
| Minimum | 1.6% | 2.1% |
| Maximum | 24.0% | 40.5% |
| Range | 22.4% | 38.4% |
| Mean | 10.5% | 13.3% |
| Median | 10.5% | 12.4% |
| Interquartile 25% (IQ1) | 8.8% | 10.8% |
| Interquartile 75% (IQ3) | 12.0% | 14.5% |
| Interquartile Range (IQR) | 3.2% | 3.8% |
| Standard Deviation (Sample) | 3.6% | 5.6% |
| Standard Deviation (Population) | 3.6% | 5.5% |
Similar Demographics by Female Disability
Demographics Similar to Immigrants from Sri Lanka by Female Disability
In terms of female disability, the demographic groups most similar to Immigrants from Sri Lanka are Asian (10.9%, a difference of 0.13%), Venezuelan (11.0%, a difference of 0.22%), Immigrants from Pakistan (10.9%, a difference of 0.49%), Immigrants from Venezuela (10.9%, a difference of 0.66%), and Immigrants from Argentina (11.0%, a difference of 0.79%).
| Demographics | Rating | Rank | Female Disability |
| Burmese | 100.0 /100 | #15 | Exceptional 10.7% |
| Okinawans | 100.0 /100 | #16 | Exceptional 10.8% |
| Indians (Asian) | 100.0 /100 | #17 | Exceptional 10.8% |
| Immigrants | Iran | 100.0 /100 | #18 | Exceptional 10.8% |
| Immigrants | Venezuela | 100.0 /100 | #19 | Exceptional 10.9% |
| Immigrants | Pakistan | 100.0 /100 | #20 | Exceptional 10.9% |
| Asians | 100.0 /100 | #21 | Exceptional 10.9% |
| Immigrants | Sri Lanka | 100.0 /100 | #22 | Exceptional 10.9% |
| Venezuelans | 100.0 /100 | #23 | Exceptional 11.0% |
| Immigrants | Argentina | 100.0 /100 | #24 | Exceptional 11.0% |
| Immigrants | Asia | 100.0 /100 | #25 | Exceptional 11.0% |
| Argentineans | 100.0 /100 | #26 | Exceptional 11.0% |
| Immigrants | Turkey | 100.0 /100 | #27 | Exceptional 11.1% |
| Egyptians | 100.0 /100 | #28 | Exceptional 11.1% |
| Immigrants | Malaysia | 100.0 /100 | #29 | Exceptional 11.1% |
Demographics Similar to Bahamians by Female Disability
In terms of female disability, the demographic groups most similar to Bahamians are Native Hawaiian (12.4%, a difference of 0.030%), Italian (12.4%, a difference of 0.040%), European (12.4%, a difference of 0.090%), Immigrants from Bahamas (12.4%, a difference of 0.12%), and British (12.4%, a difference of 0.14%).
| Demographics | Rating | Rank | Female Disability |
| Immigrants | Thailand | 14.5 /100 | #213 | Poor 12.4% |
| Panamanians | 13.5 /100 | #214 | Poor 12.4% |
| Samoans | 13.4 /100 | #215 | Poor 12.4% |
| Immigrants | Burma/Myanmar | 13.3 /100 | #216 | Poor 12.4% |
| British | 12.7 /100 | #217 | Poor 12.4% |
| Immigrants | Bahamas | 12.5 /100 | #218 | Poor 12.4% |
| Europeans | 12.1 /100 | #219 | Poor 12.4% |
| Bahamians | 11.1 /100 | #220 | Poor 12.4% |
| Native Hawaiians | 10.8 /100 | #221 | Poor 12.4% |
| Italians | 10.7 /100 | #222 | Poor 12.4% |
| Guamanians/Chamorros | 9.5 /100 | #223 | Tragic 12.5% |
| Belizeans | 9.3 /100 | #224 | Tragic 12.5% |
| Poles | 8.4 /100 | #225 | Tragic 12.5% |
| Hispanics or Latinos | 8.0 /100 | #226 | Tragic 12.5% |
| Assyrians/Chaldeans/Syriacs | 8.0 /100 | #227 | Tragic 12.5% |