Immigrants from South Africa vs Welsh Disability Age Under 5
COMPARE
Immigrants from South Africa
Welsh
Disability Age Under 5
Disability Age Under 5 Comparison
Immigrants from South Africa
Welsh
1.2%
DISABILITY AGE UNDER 5
95.6/ 100
METRIC RATING
105th/ 347
METRIC RANK
1.6%
DISABILITY AGE UNDER 5
0.0/ 100
METRIC RATING
302nd/ 347
METRIC RANK
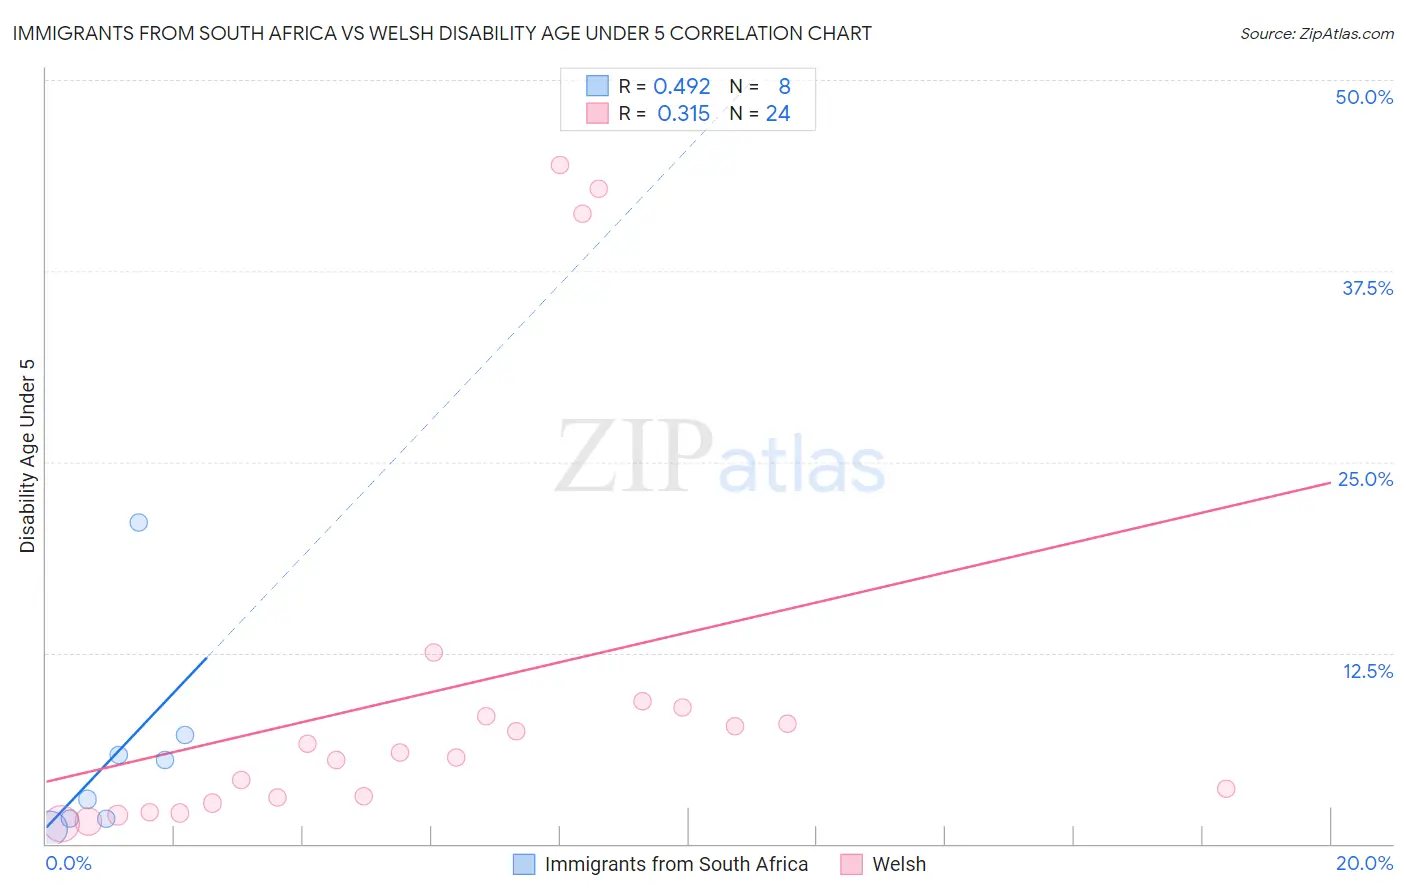
Immigrants from South Africa vs Welsh Disability Age Under 5 Correlation Chart
The statistical analysis conducted on geographies consisting of 143,498,836 people shows a moderate positive correlation between the proportion of Immigrants from South Africa and percentage of population with a disability under the age of 5 in the United States with a correlation coefficient (R) of 0.492 and weighted average of 1.2%. Similarly, the statistical analysis conducted on geographies consisting of 248,340,053 people shows a mild positive correlation between the proportion of Welsh and percentage of population with a disability under the age of 5 in the United States with a correlation coefficient (R) of 0.315 and weighted average of 1.6%, a difference of 41.2%.
Disability Age Under 5 Correlation Summary
| Measurement | Immigrants from South Africa | Welsh |
| Minimum | 0.99% | 1.3% |
| Maximum | 21.1% | 44.4% |
| Range | 20.1% | 43.1% |
| Mean | 5.8% | 10.0% |
| Median | 4.2% | 5.8% |
| Interquartile 25% (IQ1) | 1.6% | 2.8% |
| Interquartile 75% (IQ3) | 6.5% | 8.6% |
| Interquartile Range (IQR) | 4.8% | 5.8% |
| Standard Deviation (Sample) | 6.6% | 13.0% |
| Standard Deviation (Population) | 6.1% | 12.8% |
Similar Demographics by Disability Age Under 5
Demographics Similar to Immigrants from South Africa by Disability Age Under 5
In terms of disability age under 5, the demographic groups most similar to Immigrants from South Africa are Cambodian (1.2%, a difference of 0.10%), Immigrants from West Indies (1.2%, a difference of 0.14%), Indonesian (1.2%, a difference of 0.19%), Immigrants from Morocco (1.2%, a difference of 0.26%), and Immigrants from Nicaragua (1.2%, a difference of 0.26%).
| Demographics | Rating | Rank | Disability Age Under 5 |
| Immigrants | South Eastern Asia | 96.5 /100 | #98 | Exceptional 1.1% |
| Dominicans | 96.3 /100 | #99 | Exceptional 1.1% |
| Nicaraguans | 96.3 /100 | #100 | Exceptional 1.1% |
| Immigrants | Uganda | 96.1 /100 | #101 | Exceptional 1.1% |
| Immigrants | Morocco | 96.0 /100 | #102 | Exceptional 1.2% |
| Immigrants | Nicaragua | 96.0 /100 | #103 | Exceptional 1.2% |
| Indonesians | 95.9 /100 | #104 | Exceptional 1.2% |
| Immigrants | South Africa | 95.6 /100 | #105 | Exceptional 1.2% |
| Cambodians | 95.4 /100 | #106 | Exceptional 1.2% |
| Immigrants | West Indies | 95.3 /100 | #107 | Exceptional 1.2% |
| Iraqis | 95.1 /100 | #108 | Exceptional 1.2% |
| Immigrants | Panama | 95.0 /100 | #109 | Exceptional 1.2% |
| Immigrants | Lebanon | 95.0 /100 | #110 | Exceptional 1.2% |
| Senegalese | 94.6 /100 | #111 | Exceptional 1.2% |
| Immigrants | Australia | 94.4 /100 | #112 | Exceptional 1.2% |
Demographics Similar to Welsh by Disability Age Under 5
In terms of disability age under 5, the demographic groups most similar to Welsh are German Russian (1.6%, a difference of 0.12%), Swiss (1.6%, a difference of 0.16%), Shoshone (1.6%, a difference of 0.56%), Seminole (1.6%, a difference of 0.79%), and Portuguese (1.6%, a difference of 0.89%).
| Demographics | Rating | Rank | Disability Age Under 5 |
| Finns | 0.0 /100 | #295 | Tragic 1.6% |
| Poles | 0.0 /100 | #296 | Tragic 1.6% |
| Immigrants | Nonimmigrants | 0.0 /100 | #297 | Tragic 1.6% |
| Cajuns | 0.0 /100 | #298 | Tragic 1.6% |
| Portuguese | 0.0 /100 | #299 | Tragic 1.6% |
| Shoshone | 0.0 /100 | #300 | Tragic 1.6% |
| German Russians | 0.0 /100 | #301 | Tragic 1.6% |
| Welsh | 0.0 /100 | #302 | Tragic 1.6% |
| Swiss | 0.0 /100 | #303 | Tragic 1.6% |
| Seminole | 0.0 /100 | #304 | Tragic 1.6% |
| Blackfeet | 0.0 /100 | #305 | Tragic 1.6% |
| Creek | 0.0 /100 | #306 | Tragic 1.6% |
| Scottish | 0.0 /100 | #307 | Tragic 1.6% |
| Navajo | 0.0 /100 | #308 | Tragic 1.6% |
| Cape Verdeans | 0.0 /100 | #309 | Tragic 1.7% |