Immigrants from Jamaica vs Welsh Disability Age Under 5
COMPARE
Immigrants from Jamaica
Welsh
Disability Age Under 5
Disability Age Under 5 Comparison
Immigrants from Jamaica
Welsh
1.2%
DISABILITY AGE UNDER 5
58.8/ 100
METRIC RATING
170th/ 347
METRIC RANK
1.6%
DISABILITY AGE UNDER 5
0.0/ 100
METRIC RATING
302nd/ 347
METRIC RANK
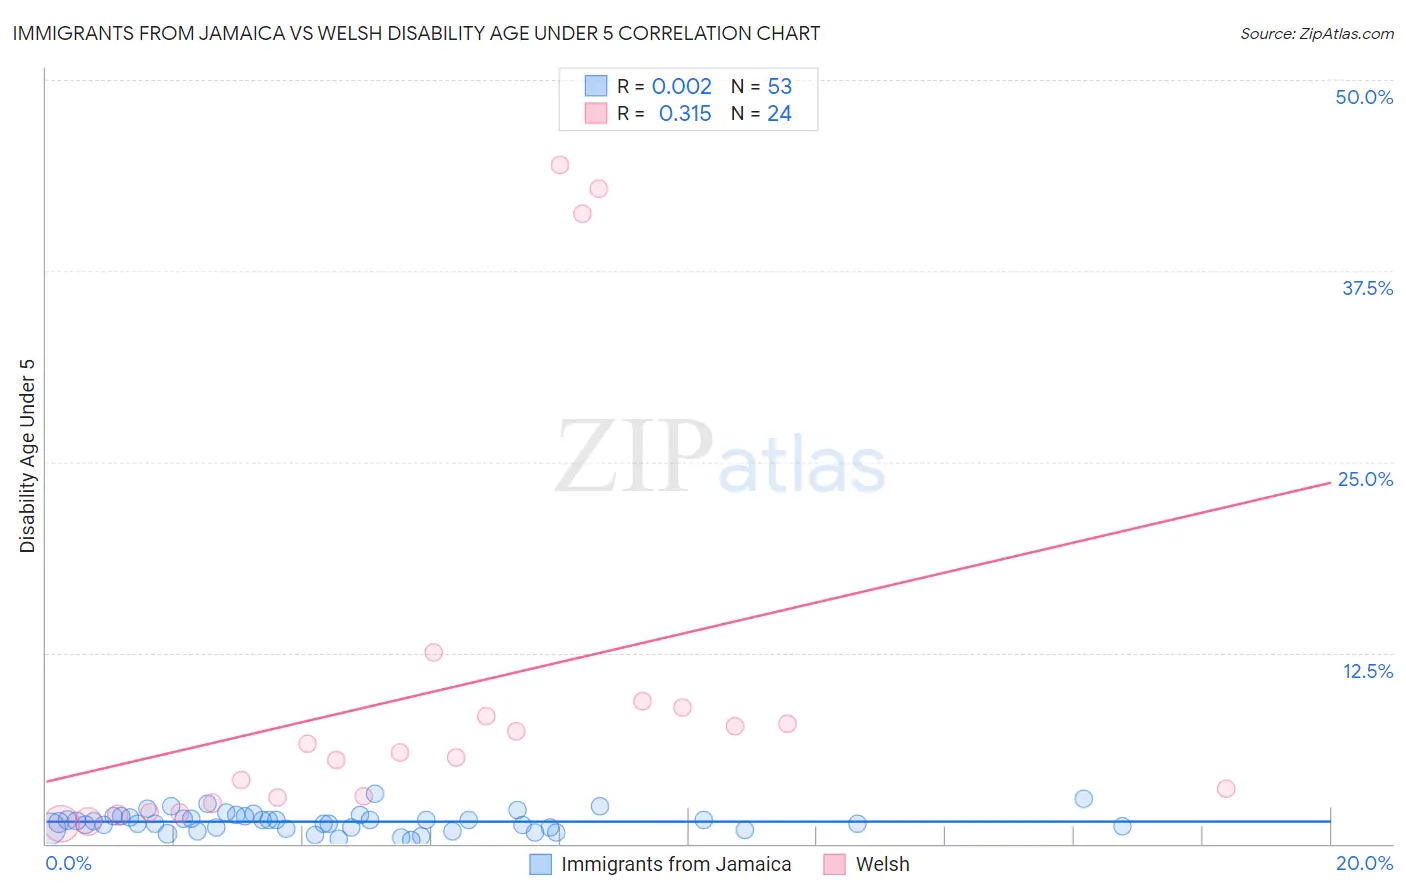
Immigrants from Jamaica vs Welsh Disability Age Under 5 Correlation Chart
The statistical analysis conducted on geographies consisting of 173,327,307 people shows no correlation between the proportion of Immigrants from Jamaica and percentage of population with a disability under the age of 5 in the United States with a correlation coefficient (R) of 0.002 and weighted average of 1.2%. Similarly, the statistical analysis conducted on geographies consisting of 248,340,053 people shows a mild positive correlation between the proportion of Welsh and percentage of population with a disability under the age of 5 in the United States with a correlation coefficient (R) of 0.315 and weighted average of 1.6%, a difference of 32.5%.
Disability Age Under 5 Correlation Summary
| Measurement | Immigrants from Jamaica | Welsh |
| Minimum | 0.28% | 1.3% |
| Maximum | 3.3% | 44.4% |
| Range | 3.0% | 43.1% |
| Mean | 1.4% | 10.0% |
| Median | 1.5% | 5.8% |
| Interquartile 25% (IQ1) | 1.0% | 2.8% |
| Interquartile 75% (IQ3) | 1.8% | 8.6% |
| Interquartile Range (IQR) | 0.78% | 5.8% |
| Standard Deviation (Sample) | 0.64% | 13.0% |
| Standard Deviation (Population) | 0.63% | 12.8% |
Similar Demographics by Disability Age Under 5
Demographics Similar to Immigrants from Jamaica by Disability Age Under 5
In terms of disability age under 5, the demographic groups most similar to Immigrants from Jamaica are Immigrants from Uruguay (1.2%, a difference of 0.020%), Sierra Leonean (1.2%, a difference of 0.030%), Guamanian/Chamorro (1.2%, a difference of 0.090%), Immigrants from Argentina (1.2%, a difference of 0.13%), and Immigrants from Central America (1.2%, a difference of 0.25%).
| Demographics | Rating | Rank | Disability Age Under 5 |
| Immigrants | Guatemala | 63.2 /100 | #163 | Good 1.2% |
| Laotians | 62.8 /100 | #164 | Good 1.2% |
| Immigrants | Kuwait | 62.6 /100 | #165 | Good 1.2% |
| Immigrants | Central America | 61.4 /100 | #166 | Good 1.2% |
| Immigrants | Argentina | 60.2 /100 | #167 | Good 1.2% |
| Sierra Leoneans | 59.1 /100 | #168 | Average 1.2% |
| Immigrants | Uruguay | 59.0 /100 | #169 | Average 1.2% |
| Immigrants | Jamaica | 58.8 /100 | #170 | Average 1.2% |
| Guamanians/Chamorros | 57.8 /100 | #171 | Average 1.2% |
| Crow | 51.0 /100 | #172 | Average 1.2% |
| Immigrants | Ireland | 50.3 /100 | #173 | Average 1.2% |
| Immigrants | Latvia | 50.0 /100 | #174 | Average 1.2% |
| Immigrants | Nigeria | 50.0 /100 | #175 | Average 1.2% |
| Immigrants | Kenya | 48.6 /100 | #176 | Average 1.2% |
| Comanche | 47.5 /100 | #177 | Average 1.2% |
Demographics Similar to Welsh by Disability Age Under 5
In terms of disability age under 5, the demographic groups most similar to Welsh are German Russian (1.6%, a difference of 0.12%), Swiss (1.6%, a difference of 0.16%), Shoshone (1.6%, a difference of 0.56%), Seminole (1.6%, a difference of 0.79%), and Portuguese (1.6%, a difference of 0.89%).
| Demographics | Rating | Rank | Disability Age Under 5 |
| Finns | 0.0 /100 | #295 | Tragic 1.6% |
| Poles | 0.0 /100 | #296 | Tragic 1.6% |
| Immigrants | Nonimmigrants | 0.0 /100 | #297 | Tragic 1.6% |
| Cajuns | 0.0 /100 | #298 | Tragic 1.6% |
| Portuguese | 0.0 /100 | #299 | Tragic 1.6% |
| Shoshone | 0.0 /100 | #300 | Tragic 1.6% |
| German Russians | 0.0 /100 | #301 | Tragic 1.6% |
| Welsh | 0.0 /100 | #302 | Tragic 1.6% |
| Swiss | 0.0 /100 | #303 | Tragic 1.6% |
| Seminole | 0.0 /100 | #304 | Tragic 1.6% |
| Blackfeet | 0.0 /100 | #305 | Tragic 1.6% |
| Creek | 0.0 /100 | #306 | Tragic 1.6% |
| Scottish | 0.0 /100 | #307 | Tragic 1.6% |
| Navajo | 0.0 /100 | #308 | Tragic 1.6% |
| Cape Verdeans | 0.0 /100 | #309 | Tragic 1.7% |