Immigrants from South Africa vs Immigrants from Eastern Europe Male Disability
COMPARE
Immigrants from South Africa
Immigrants from Eastern Europe
Male Disability
Male Disability Comparison
Immigrants from South Africa
Immigrants from Eastern Europe
10.8%
MALE DISABILITY
91.8/ 100
METRIC RATING
116th/ 347
METRIC RANK
10.7%
MALE DISABILITY
95.3/ 100
METRIC RATING
102nd/ 347
METRIC RANK
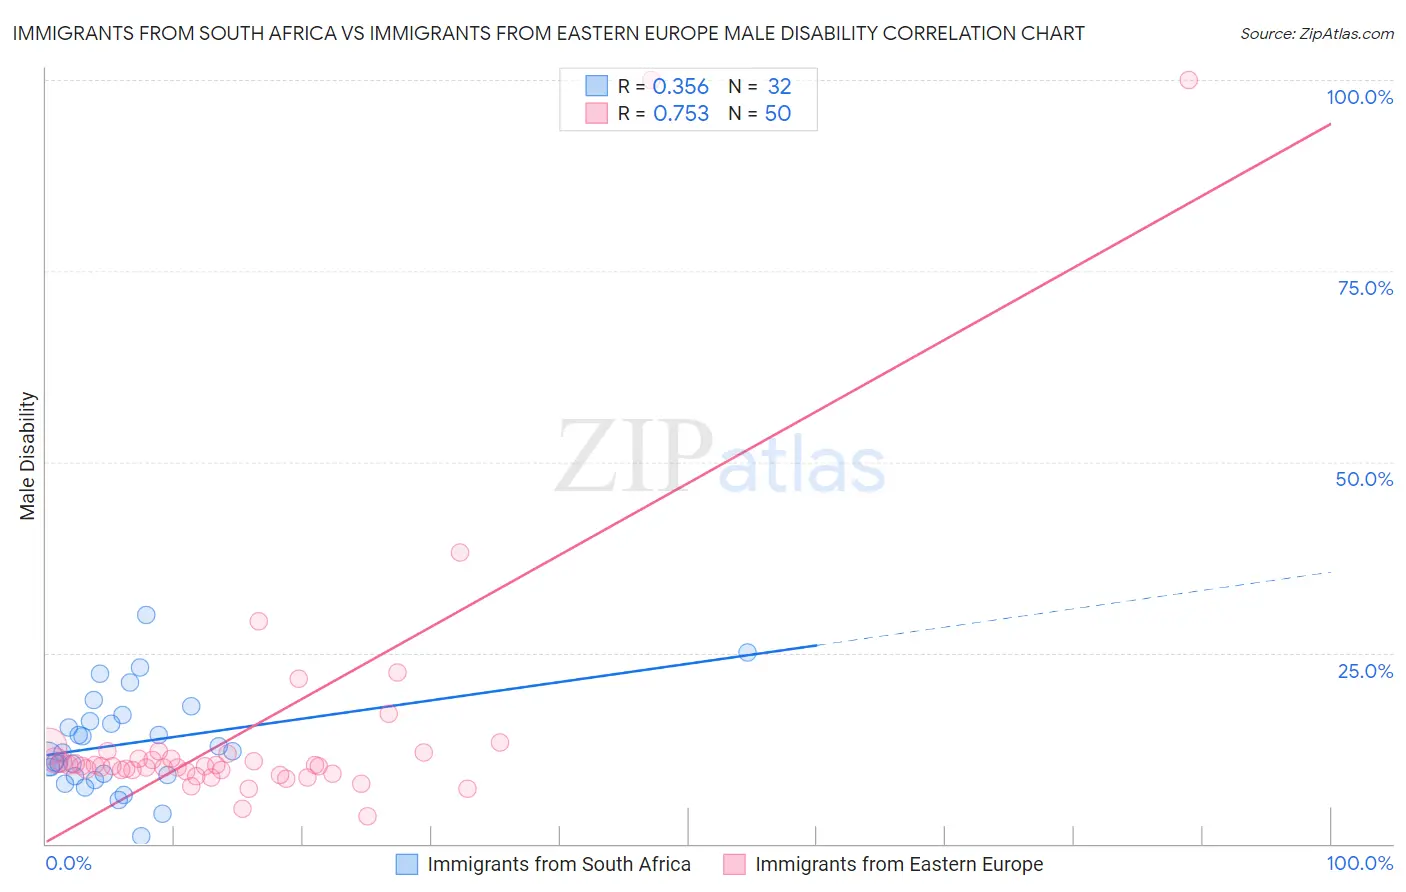
Immigrants from South Africa vs Immigrants from Eastern Europe Male Disability Correlation Chart
The statistical analysis conducted on geographies consisting of 233,300,500 people shows a mild positive correlation between the proportion of Immigrants from South Africa and percentage of males with a disability in the United States with a correlation coefficient (R) of 0.356 and weighted average of 10.8%. Similarly, the statistical analysis conducted on geographies consisting of 475,764,615 people shows a strong positive correlation between the proportion of Immigrants from Eastern Europe and percentage of males with a disability in the United States with a correlation coefficient (R) of 0.753 and weighted average of 10.7%, a difference of 0.87%.
Male Disability Correlation Summary
| Measurement | Immigrants from South Africa | Immigrants from Eastern Europe |
| Minimum | 0.92% | 3.6% |
| Maximum | 30.0% | 100.0% |
| Range | 29.0% | 96.4% |
| Mean | 13.2% | 15.0% |
| Median | 12.0% | 10.2% |
| Interquartile 25% (IQ1) | 8.9% | 9.6% |
| Interquartile 75% (IQ3) | 16.5% | 11.8% |
| Interquartile Range (IQR) | 7.5% | 2.3% |
| Standard Deviation (Sample) | 6.4% | 18.4% |
| Standard Deviation (Population) | 6.3% | 18.2% |
Demographics Similar to Immigrants from South Africa and Immigrants from Eastern Europe by Male Disability
In terms of male disability, the demographic groups most similar to Immigrants from South Africa are Immigrants from Barbados (10.8%, a difference of 0.080%), Central American (10.8%, a difference of 0.17%), Eastern European (10.9%, a difference of 0.21%), Immigrants from Zimbabwe (10.8%, a difference of 0.24%), and Immigrants from Cuba (10.9%, a difference of 0.29%). Similarly, the demographic groups most similar to Immigrants from Eastern Europe are Uruguayan (10.7%, a difference of 0.010%), Immigrants from Nigeria (10.8%, a difference of 0.080%), Immigrants from Brazil (10.8%, a difference of 0.090%), Immigrants from Greece (10.7%, a difference of 0.10%), and Immigrants from Syria (10.8%, a difference of 0.13%).
| Demographics | Rating | Rank | Male Disability |
| Immigrants | Switzerland | 96.1 /100 | #99 | Exceptional 10.7% |
| Immigrants | Kazakhstan | 95.9 /100 | #100 | Exceptional 10.7% |
| Immigrants | Greece | 95.6 /100 | #101 | Exceptional 10.7% |
| Immigrants | Eastern Europe | 95.3 /100 | #102 | Exceptional 10.7% |
| Uruguayans | 95.3 /100 | #103 | Exceptional 10.7% |
| Immigrants | Nigeria | 95.1 /100 | #104 | Exceptional 10.8% |
| Immigrants | Brazil | 95.0 /100 | #105 | Exceptional 10.8% |
| Immigrants | Syria | 94.9 /100 | #106 | Exceptional 10.8% |
| Immigrants | Eastern Africa | 94.3 /100 | #107 | Exceptional 10.8% |
| Immigrants | Belgium | 94.2 /100 | #108 | Exceptional 10.8% |
| Immigrants | Uganda | 94.0 /100 | #109 | Exceptional 10.8% |
| Immigrants | Immigrants | 93.9 /100 | #110 | Exceptional 10.8% |
| Immigrants | Uruguay | 93.8 /100 | #111 | Exceptional 10.8% |
| Ghanaians | 93.4 /100 | #112 | Exceptional 10.8% |
| Immigrants | Zimbabwe | 93.0 /100 | #113 | Exceptional 10.8% |
| Central Americans | 92.7 /100 | #114 | Exceptional 10.8% |
| Immigrants | Barbados | 92.2 /100 | #115 | Exceptional 10.8% |
| Immigrants | South Africa | 91.8 /100 | #116 | Exceptional 10.8% |
| Eastern Europeans | 90.6 /100 | #117 | Exceptional 10.9% |
| Immigrants | Cuba | 90.2 /100 | #118 | Exceptional 10.9% |
| Armenians | 90.1 /100 | #119 | Exceptional 10.9% |