Immigrants from South Africa vs Fijian Disability Age 65 to 74
COMPARE
Immigrants from South Africa
Fijian
Disability Age 65 to 74
Disability Age 65 to 74 Comparison
Immigrants from South Africa
Fijians
21.7%
DISABILITY AGE 65 TO 74
99.3/ 100
METRIC RATING
67th/ 347
METRIC RANK
27.0%
DISABILITY AGE 65 TO 74
0.0/ 100
METRIC RATING
297th/ 347
METRIC RANK
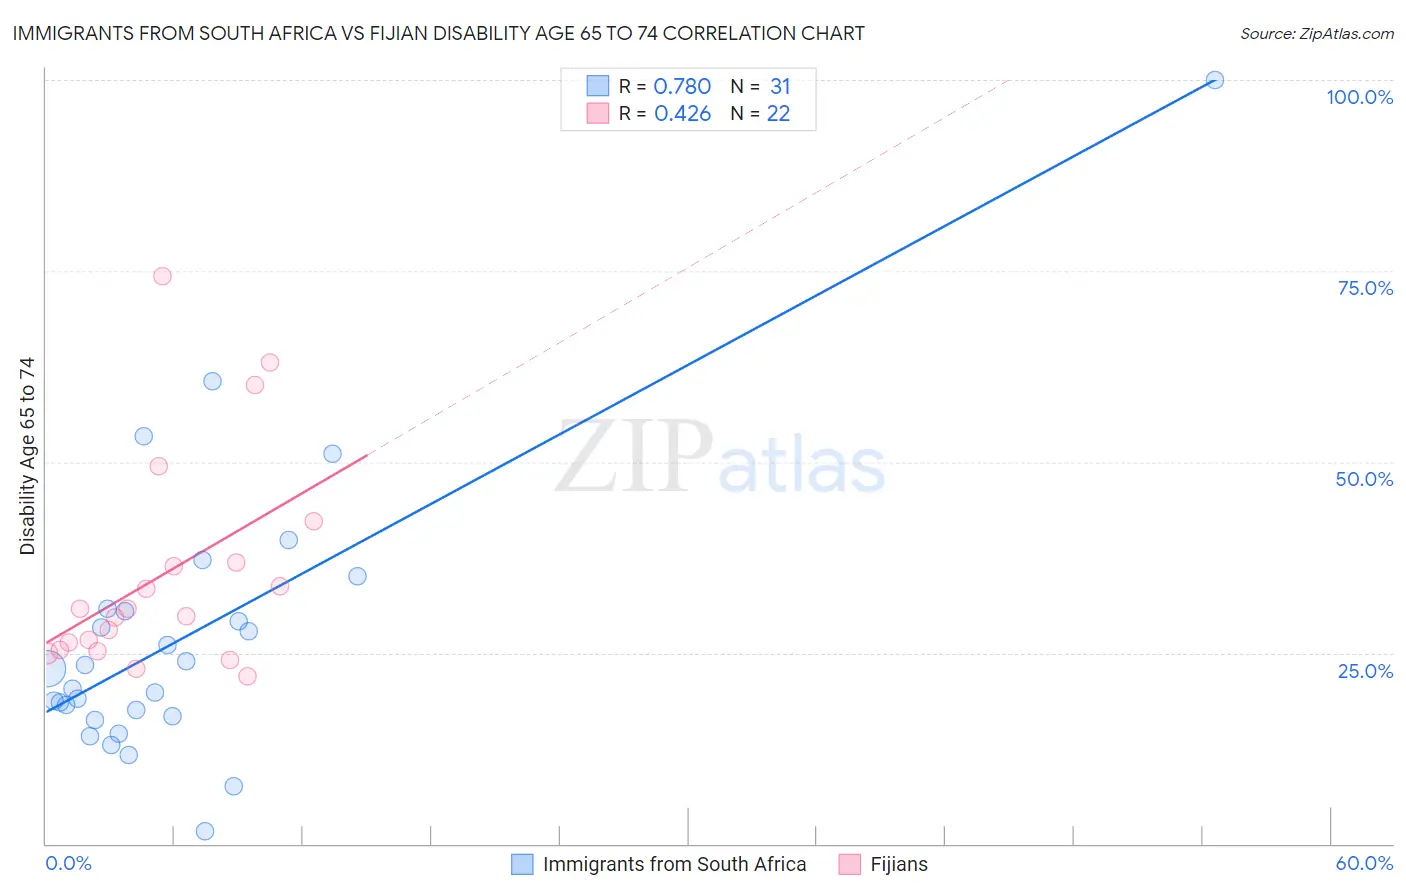
Immigrants from South Africa vs Fijian Disability Age 65 to 74 Correlation Chart
The statistical analysis conducted on geographies consisting of 233,082,917 people shows a strong positive correlation between the proportion of Immigrants from South Africa and percentage of population with a disability between the ages 65 and 75 in the United States with a correlation coefficient (R) of 0.780 and weighted average of 21.7%. Similarly, the statistical analysis conducted on geographies consisting of 55,925,338 people shows a moderate positive correlation between the proportion of Fijians and percentage of population with a disability between the ages 65 and 75 in the United States with a correlation coefficient (R) of 0.426 and weighted average of 27.0%, a difference of 24.7%.
Disability Age 65 to 74 Correlation Summary
| Measurement | Immigrants from South Africa | Fijian |
| Minimum | 1.7% | 22.0% |
| Maximum | 100.0% | 74.4% |
| Range | 98.3% | 52.4% |
| Mean | 27.3% | 35.3% |
| Median | 23.0% | 30.3% |
| Interquartile 25% (IQ1) | 16.7% | 25.4% |
| Interquartile 75% (IQ3) | 30.8% | 36.7% |
| Interquartile Range (IQR) | 14.2% | 11.3% |
| Standard Deviation (Sample) | 18.8% | 14.2% |
| Standard Deviation (Population) | 18.5% | 13.9% |
Similar Demographics by Disability Age 65 to 74
Demographics Similar to Immigrants from South Africa by Disability Age 65 to 74
In terms of disability age 65 to 74, the demographic groups most similar to Immigrants from South Africa are Immigrants from Scotland (21.7%, a difference of 0.090%), Maltese (21.6%, a difference of 0.20%), Immigrants from Russia (21.6%, a difference of 0.22%), Immigrants from Egypt (21.7%, a difference of 0.22%), and Immigrants from Latvia (21.6%, a difference of 0.23%).
| Demographics | Rating | Rank | Disability Age 65 to 74 |
| Immigrants | North Macedonia | 99.5 /100 | #60 | Exceptional 21.6% |
| Egyptians | 99.5 /100 | #61 | Exceptional 21.6% |
| Carpatho Rusyns | 99.5 /100 | #62 | Exceptional 21.6% |
| Immigrants | Europe | 99.4 /100 | #63 | Exceptional 21.6% |
| Immigrants | Latvia | 99.4 /100 | #64 | Exceptional 21.6% |
| Immigrants | Russia | 99.4 /100 | #65 | Exceptional 21.6% |
| Maltese | 99.4 /100 | #66 | Exceptional 21.6% |
| Immigrants | South Africa | 99.3 /100 | #67 | Exceptional 21.7% |
| Immigrants | Scotland | 99.3 /100 | #68 | Exceptional 21.7% |
| Immigrants | Egypt | 99.2 /100 | #69 | Exceptional 21.7% |
| Chinese | 99.2 /100 | #70 | Exceptional 21.7% |
| Immigrants | Belarus | 99.2 /100 | #71 | Exceptional 21.7% |
| Immigrants | Hungary | 99.2 /100 | #72 | Exceptional 21.7% |
| Immigrants | Venezuela | 99.0 /100 | #73 | Exceptional 21.8% |
| Cambodians | 99.0 /100 | #74 | Exceptional 21.8% |
Demographics Similar to Fijians by Disability Age 65 to 74
In terms of disability age 65 to 74, the demographic groups most similar to Fijians are Immigrants from Yemen (27.0%, a difference of 0.020%), Potawatomi (27.0%, a difference of 0.050%), Immigrants from Dominican Republic (27.0%, a difference of 0.080%), Immigrants from Mexico (27.1%, a difference of 0.40%), and Central American Indian (27.1%, a difference of 0.41%).
| Demographics | Rating | Rank | Disability Age 65 to 74 |
| Immigrants | Cabo Verde | 0.0 /100 | #290 | Tragic 26.3% |
| Spanish American Indians | 0.0 /100 | #291 | Tragic 26.4% |
| Blackfeet | 0.0 /100 | #292 | Tragic 26.6% |
| Immigrants | Central America | 0.0 /100 | #293 | Tragic 26.6% |
| Dominicans | 0.0 /100 | #294 | Tragic 26.7% |
| Hispanics or Latinos | 0.0 /100 | #295 | Tragic 26.7% |
| Bangladeshis | 0.0 /100 | #296 | Tragic 26.8% |
| Fijians | 0.0 /100 | #297 | Tragic 27.0% |
| Immigrants | Yemen | 0.0 /100 | #298 | Tragic 27.0% |
| Potawatomi | 0.0 /100 | #299 | Tragic 27.0% |
| Immigrants | Dominican Republic | 0.0 /100 | #300 | Tragic 27.0% |
| Immigrants | Mexico | 0.0 /100 | #301 | Tragic 27.1% |
| Central American Indians | 0.0 /100 | #302 | Tragic 27.1% |
| Tlingit-Haida | 0.0 /100 | #303 | Tragic 27.1% |
| Puget Sound Salish | 0.0 /100 | #304 | Tragic 27.2% |