Immigrants from South Africa vs Immigrants from Lebanon Disability Age 65 to 74

COMPARE

Immigrants from South Africa
Race
Ancestry
AfghanAfricanAlaska NativeAlaskan AthabascanAlbanianAleutAlsatianAmericanApacheArabArapahoArgentineanArmenianAssyrian/Chaldean/SyriacAustralianAustrianBahamianBangladeshiBarbadianBasqueBelgianBelizeanBermudanBhutaneseBlackfeetBolivianBrazilianBritishBritish West IndianBulgarianBurmeseCajunCambodianCanadianCape VerdeanCarpatho RusynCelticCentral AmericanCentral American IndianCherokeeCheyenneChickasawChileanChineseChippewaChoctawColombianColvilleComancheCosta RicanCreeCreekCroatianCrowCubanCypriotCzechCzechoslovakianDanishDelawareDominicanDutchDutch West IndianEastern EuropeanEcuadorianEgyptianEnglishEstonianEthiopianEuropeanFijianFilipinoFinnishFrenchFrench American IndianFrench CanadianGermanGerman RussianGhanaianGreekGuamanian/ChamorroGuatemalanGuyaneseHaitianHmongHonduranHopiHoumaHungarianIcelanderIndian (Asian)IndonesianInupiatIranianIraqiIrishIroquoisIsraeliItalianJamaicanJapaneseJordanianKenyanKiowaKoreanLaotianLatvianLebaneseLiberianLithuanianLumbeeLuxembourgerMacedonianMalaysianMalteseMarshalleseMenomineeMexicanMexican American IndianMongolianMoroccanNative HawaiianNavajoNepaleseNew ZealanderNicaraguanNigerianNorthern EuropeanNorwegianOkinawanOsageOttawaPaiutePakistaniPalestinianPanamanianParaguayanPennsylvania GermanPeruvianPimaPolishPortuguesePotawatomiPuebloPuerto RicanPuget Sound SalishRomanianRussianSalvadoranSamoanScandinavianScotch-IrishScottishSeminoleSenegaleseSerbianShoshoneSierra LeoneanSiouxSlavicSlovakSloveneSomaliSouth AfricanSouth AmericanSouth American IndianSoviet UnionSpaniardSpanishSpanish AmericanSpanish American IndianSri LankanSubsaharan AfricanSudaneseSwedishSwissSyrianTaiwaneseThaiTlingit-HaidaTohono O'OdhamTonganTrinidadian and TobagonianTsimshianTurkishU.S. Virgin IslanderUgandanUkrainianUruguayanUteVenezuelanVietnameseWelshWest IndianYakamaYaquiYugoslavianYumanYup'ikZimbabwean
Immigration
NonimmigrantsImmigrantsAfghanistanAfricaAlbaniaArgentinaArmeniaAsiaAustraliaAustriaBahamasBangladeshBarbadosBelarusBelgiumBelizeBoliviaBosnia and HerzegovinaBrazilBulgariaBurma/MyanmarCabo VerdeCambodiaCameroonCanadaCaribbeanCentral AmericaChileChinaColombiaCongoCosta RicaCroatiaCubaCzechoslovakiaDenmarkDominicaDominican RepublicEastern AfricaEastern AsiaEastern EuropeEcuadorEgyptEl SalvadorEnglandEritreaEthiopiaEuropeFijiFranceGermanyGhanaGreeceGrenadaGuatemalaGuyanaHaitiHondurasHong KongHungaryIndiaIndonesiaIranIraqIrelandIsraelItalyJamaicaJapanJordanKazakhstanKenyaKoreaKuwaitLaosLatin AmericaLatviaLiberiaLithuaniaMalaysiaMexicoMicronesiaMiddle AfricaMoldovaMoroccoNepalNetherlandsNicaraguaNigeriaNorth AmericaNorth MacedoniaNorthern AfricaNorthern EuropeNorwayOceaniaPakistanPanamaPeruPhilippinesPolandPortugalRomaniaRussiaSaudi ArabiaScotlandSenegalSerbiaSierra LeoneSingaporeSomaliaSouth AfricaSouth AmericaSouth Central AsiaSouth Eastern AsiaSouthern EuropeSpainSri LankaSt. Vincent and the GrenadinesSudanSwedenSwitzerlandSyriaTaiwanThailandTrinidad and TobagoTurkeyUgandaUkraineUruguayUzbekistanVenezuelaVietnamWest IndiesWestern AfricaWestern AsiaWestern EuropeYemenZaireZimbabweAzores
Immigrants from Lebanon
Race
Ancestry
AfghanAfricanAlaska NativeAlaskan AthabascanAlbanianAleutAlsatianAmericanApacheArabArapahoArgentineanArmenianAssyrian/Chaldean/SyriacAustralianAustrianBahamianBangladeshiBarbadianBasqueBelgianBelizeanBermudanBhutaneseBlackfeetBolivianBrazilianBritishBritish West IndianBulgarianBurmeseCajunCambodianCanadianCape VerdeanCarpatho RusynCelticCentral AmericanCentral American IndianCherokeeCheyenneChickasawChileanChineseChippewaChoctawColombianColvilleComancheCosta RicanCreeCreekCroatianCrowCubanCypriotCzechCzechoslovakianDanishDelawareDominicanDutchDutch West IndianEastern EuropeanEcuadorianEgyptianEnglishEstonianEthiopianEuropeanFijianFilipinoFinnishFrenchFrench American IndianFrench CanadianGermanGerman RussianGhanaianGreekGuamanian/ChamorroGuatemalanGuyaneseHaitianHmongHonduranHopiHoumaHungarianIcelanderIndian (Asian)IndonesianInupiatIranianIraqiIrishIroquoisIsraeliItalianJamaicanJapaneseJordanianKenyanKiowaKoreanLaotianLatvianLebaneseLiberianLithuanianLumbeeLuxembourgerMacedonianMalaysianMalteseMarshalleseMenomineeMexicanMexican American IndianMongolianMoroccanNative HawaiianNavajoNepaleseNew ZealanderNicaraguanNigerianNorthern EuropeanNorwegianOkinawanOsageOttawaPaiutePakistaniPalestinianPanamanianParaguayanPennsylvania GermanPeruvianPimaPolishPortuguesePotawatomiPuebloPuerto RicanPuget Sound SalishRomanianRussianSalvadoranSamoanScandinavianScotch-IrishScottishSeminoleSenegaleseSerbianShoshoneSierra LeoneanSiouxSlavicSlovakSloveneSomaliSouth AfricanSouth AmericanSouth American IndianSoviet UnionSpaniardSpanishSpanish AmericanSpanish American IndianSri LankanSubsaharan AfricanSudaneseSwedishSwissSyrianTaiwaneseThaiTlingit-HaidaTohono O'OdhamTonganTrinidadian and TobagonianTsimshianTurkishU.S. Virgin IslanderUgandanUkrainianUruguayanUteVenezuelanVietnameseWelshWest IndianYakamaYaquiYugoslavianYumanYup'ikZimbabwean
Immigration
NonimmigrantsImmigrantsAfghanistanAfricaAlbaniaArgentinaArmeniaAsiaAustraliaAustriaBahamasBangladeshBarbadosBelarusBelgiumBelizeBoliviaBosnia and HerzegovinaBrazilBulgariaBurma/MyanmarCabo VerdeCambodiaCameroonCanadaCaribbeanCentral AmericaChileChinaColombiaCongoCosta RicaCroatiaCubaCzechoslovakiaDenmarkDominicaDominican RepublicEastern AfricaEastern AsiaEastern EuropeEcuadorEgyptEl SalvadorEnglandEritreaEthiopiaEuropeFijiFranceGermanyGhanaGreeceGrenadaGuatemalaGuyanaHaitiHondurasHong KongHungaryIndiaIndonesiaIranIraqIrelandIsraelItalyJamaicaJapanJordanKazakhstanKenyaKoreaKuwaitLaosLatin AmericaLatviaLebanonLiberiaLithuaniaMalaysiaMexicoMicronesiaMiddle AfricaMoldovaMoroccoNepalNetherlandsNicaraguaNigeriaNorth AmericaNorth MacedoniaNorthern AfricaNorthern EuropeNorwayOceaniaPakistanPanamaPeruPhilippinesPolandPortugalRomaniaRussiaSaudi ArabiaScotlandSenegalSerbiaSierra LeoneSingaporeSomaliaSouth AmericaSouth Central AsiaSouth Eastern AsiaSouthern EuropeSpainSri LankaSt. Vincent and the GrenadinesSudanSwedenSwitzerlandSyriaTaiwanThailandTrinidad and TobagoTurkeyUgandaUkraineUruguayUzbekistanVenezuelaVietnamWest IndiesWestern AfricaWestern AsiaWestern EuropeYemenZaireZimbabweAzores
Disability Age 65 to 74
Income
Poverty
Unemployment
Labor Participation
Family Structure
Vehicle Availability
Education Level
Disability

Disability Age 65 to 74 Comparison

Immigrants from South Africa

Immigrants from Lebanon

Exceptional
Exceptional
21.7%
DISABILITY AGE 65 TO 74
99.3/ 100
METRIC RATING
67th/ 347
METRIC RANK
21.9%
DISABILITY AGE 65 TO 74
98.4/ 100
METRIC RATING
85th/ 347
METRIC RANK

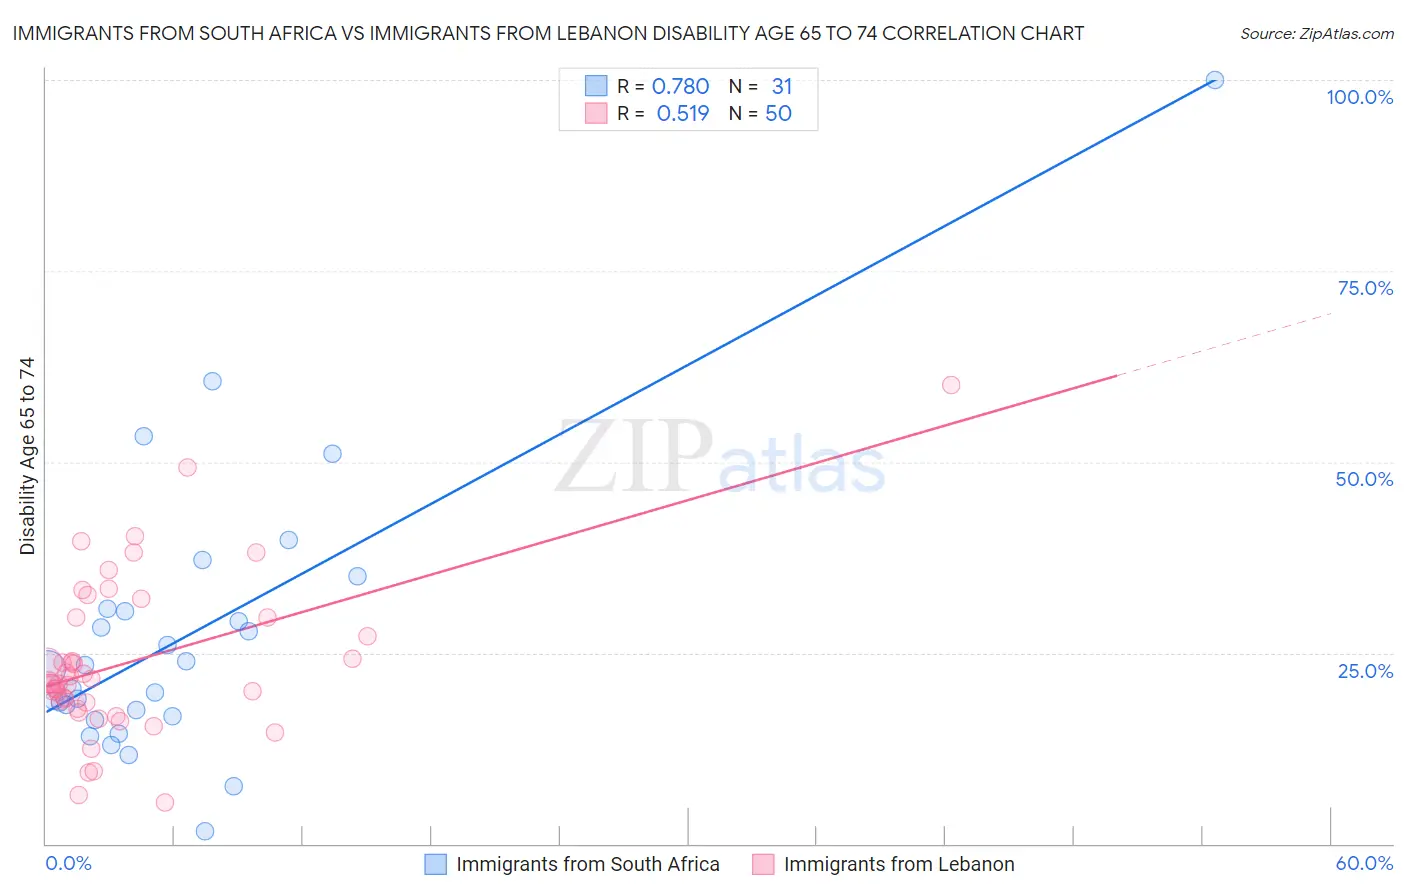
Immigrants from South Africa vs Immigrants from Lebanon Disability Age 65 to 74 Correlation Chart

The statistical analysis conducted on geographies consisting of 233,082,917 people shows a strong positive correlation between the proportion of Immigrants from South Africa and percentage of population with a disability between the ages 65 and 75 in the United States with a correlation coefficient (R) of 0.780 and weighted average of 21.7%. Similarly, the statistical analysis conducted on geographies consisting of 217,046,866 people shows a substantial positive correlation between the proportion of Immigrants from Lebanon and percentage of population with a disability between the ages 65 and 75 in the United States with a correlation coefficient (R) of 0.519 and weighted average of 21.9%, a difference of 1.3%.
Immigrants from South Africa vs Immigrants from Lebanon Disability Age 65 to 74

Disability Age 65 to 74 Correlation Summary

MeasurementImmigrants from South AfricaImmigrants from Lebanon
Minimum1.7%5.3%
Maximum100.0%60.0%
Range98.3%54.7%
Mean27.3%23.7%
Median23.0%21.0%
Interquartile 25% (IQ1)16.7%18.6%
Interquartile 75% (IQ3)30.8%29.6%
Interquartile Range (IQR)14.2%11.1%
Standard Deviation (Sample)18.8%10.4%
Standard Deviation (Population)18.5%10.2%

Demographics Similar to Immigrants from South Africa and Immigrants from Lebanon by Disability Age 65 to 74

In terms of disability age 65 to 74, the demographic groups most similar to Immigrants from South Africa are Immigrants from Scotland (21.7%, a difference of 0.090%), Maltese (21.6%, a difference of 0.20%), Immigrants from Egypt (21.7%, a difference of 0.22%), Chinese (21.7%, a difference of 0.23%), and Immigrants from Belarus (21.7%, a difference of 0.29%). Similarly, the demographic groups most similar to Immigrants from Lebanon are South African (21.9%, a difference of 0.080%), Immigrants from Spain (21.9%, a difference of 0.10%), Immigrants from Brazil (21.9%, a difference of 0.12%), Immigrants from Indonesia (21.9%, a difference of 0.29%), and Croatian (21.8%, a difference of 0.55%).
DemographicsRating | RankDisability Age 65 to 74
Maltese
99.4
/100
|
#66
Exceptional
21.6%
Immigrants | South Africa
99.3
/100
|
#67
Exceptional
21.7%
Immigrants | Scotland
99.3
/100
|
#68
Exceptional
21.7%
Immigrants | Egypt
99.2
/100
|
#69
Exceptional
21.7%
Chinese
99.2
/100
|
#70
Exceptional
21.7%
Immigrants | Belarus
99.2
/100
|
#71
Exceptional
21.7%
Immigrants | Hungary
99.2
/100
|
#72
Exceptional
21.7%
Immigrants | Venezuela
99.0
/100
|
#73
Exceptional
21.8%
Cambodians
99.0
/100
|
#74
Exceptional
21.8%
Mongolians
99.0
/100
|
#75
Exceptional
21.8%
Greeks
99.0
/100
|
#76
Exceptional
21.8%
Immigrants | Poland
99.0
/100
|
#77
Exceptional
21.8%
Immigrants | Eastern Europe
99.0
/100
|
#78
Exceptional
21.8%
Venezuelans
99.0
/100
|
#79
Exceptional
21.8%
Immigrants | Norway
98.9
/100
|
#80
Exceptional
21.8%
Croatians
98.9
/100
|
#81
Exceptional
21.8%
Immigrants | Indonesia
98.7
/100
|
#82
Exceptional
21.9%
Immigrants | Brazil
98.5
/100
|
#83
Exceptional
21.9%
Immigrants | Spain
98.5
/100
|
#84
Exceptional
21.9%
Immigrants | Lebanon
98.4
/100
|
#85
Exceptional
21.9%
South Africans
98.4
/100
|
#86
Exceptional
21.9%