Filipino vs Fijian Disability Age 65 to 74
COMPARE
Filipino
Fijian
Disability Age 65 to 74
Disability Age 65 to 74 Comparison
Filipinos
Fijians
19.0%
DISABILITY AGE 65 TO 74
100.0/ 100
METRIC RATING
2nd/ 347
METRIC RANK
27.0%
DISABILITY AGE 65 TO 74
0.0/ 100
METRIC RATING
297th/ 347
METRIC RANK
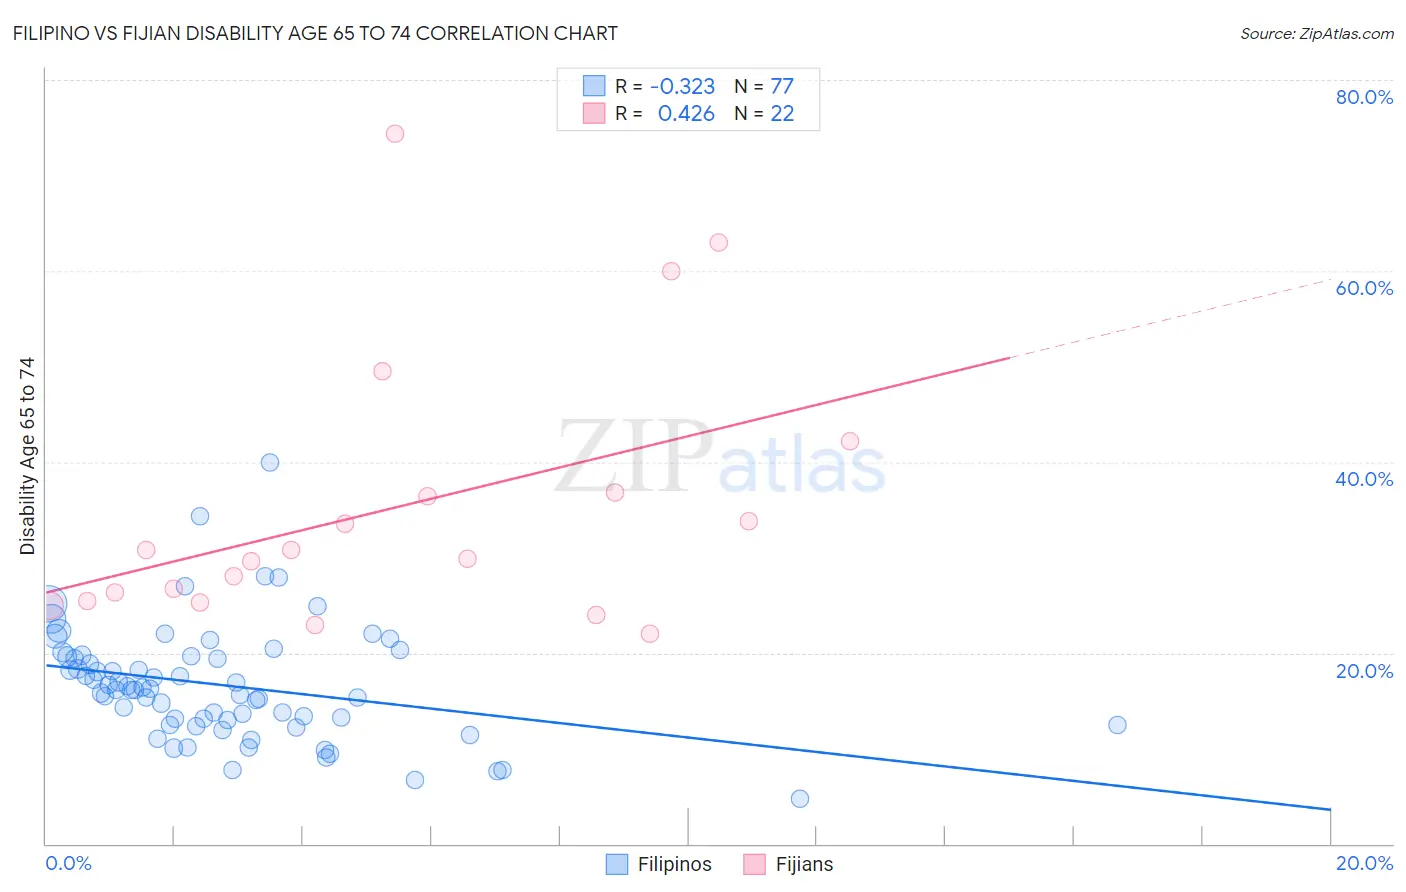
Filipino vs Fijian Disability Age 65 to 74 Correlation Chart
The statistical analysis conducted on geographies consisting of 253,881,065 people shows a mild negative correlation between the proportion of Filipinos and percentage of population with a disability between the ages 65 and 75 in the United States with a correlation coefficient (R) of -0.323 and weighted average of 19.0%. Similarly, the statistical analysis conducted on geographies consisting of 55,925,338 people shows a moderate positive correlation between the proportion of Fijians and percentage of population with a disability between the ages 65 and 75 in the United States with a correlation coefficient (R) of 0.426 and weighted average of 27.0%, a difference of 42.1%.
Disability Age 65 to 74 Correlation Summary
| Measurement | Filipino | Fijian |
| Minimum | 4.7% | 22.0% |
| Maximum | 40.0% | 74.4% |
| Range | 35.3% | 52.4% |
| Mean | 16.6% | 35.3% |
| Median | 16.1% | 30.3% |
| Interquartile 25% (IQ1) | 12.7% | 25.4% |
| Interquartile 75% (IQ3) | 19.6% | 36.7% |
| Interquartile Range (IQR) | 6.9% | 11.3% |
| Standard Deviation (Sample) | 6.0% | 14.2% |
| Standard Deviation (Population) | 6.0% | 13.9% |
Similar Demographics by Disability Age 65 to 74
Demographics Similar to Filipinos by Disability Age 65 to 74
In terms of disability age 65 to 74, the demographic groups most similar to Filipinos are Immigrants from Taiwan (18.8%, a difference of 1.2%), Immigrants from India (19.7%, a difference of 3.6%), Immigrants from Hong Kong (19.9%, a difference of 4.5%), Immigrants from Israel (19.9%, a difference of 4.8%), and Iranian (19.9%, a difference of 4.9%).
| Demographics | Rating | Rank | Disability Age 65 to 74 |
| Immigrants | Taiwan | 100.0 /100 | #1 | Exceptional 18.8% |
| Filipinos | 100.0 /100 | #2 | Exceptional 19.0% |
| Immigrants | India | 100.0 /100 | #3 | Exceptional 19.7% |
| Immigrants | Hong Kong | 100.0 /100 | #4 | Exceptional 19.9% |
| Immigrants | Israel | 100.0 /100 | #5 | Exceptional 19.9% |
| Iranians | 100.0 /100 | #6 | Exceptional 19.9% |
| Cypriots | 100.0 /100 | #7 | Exceptional 20.1% |
| Thais | 100.0 /100 | #8 | Exceptional 20.1% |
| Immigrants | China | 100.0 /100 | #9 | Exceptional 20.3% |
| Immigrants | Eastern Asia | 100.0 /100 | #10 | Exceptional 20.3% |
| Immigrants | Ireland | 100.0 /100 | #11 | Exceptional 20.3% |
| Immigrants | Korea | 100.0 /100 | #12 | Exceptional 20.4% |
| Immigrants | Singapore | 100.0 /100 | #13 | Exceptional 20.4% |
| Indians (Asian) | 100.0 /100 | #14 | Exceptional 20.5% |
| Paraguayans | 100.0 /100 | #15 | Exceptional 20.5% |
Demographics Similar to Fijians by Disability Age 65 to 74
In terms of disability age 65 to 74, the demographic groups most similar to Fijians are Immigrants from Yemen (27.0%, a difference of 0.020%), Potawatomi (27.0%, a difference of 0.050%), Immigrants from Dominican Republic (27.0%, a difference of 0.080%), Immigrants from Mexico (27.1%, a difference of 0.40%), and Central American Indian (27.1%, a difference of 0.41%).
| Demographics | Rating | Rank | Disability Age 65 to 74 |
| Immigrants | Cabo Verde | 0.0 /100 | #290 | Tragic 26.3% |
| Spanish American Indians | 0.0 /100 | #291 | Tragic 26.4% |
| Blackfeet | 0.0 /100 | #292 | Tragic 26.6% |
| Immigrants | Central America | 0.0 /100 | #293 | Tragic 26.6% |
| Dominicans | 0.0 /100 | #294 | Tragic 26.7% |
| Hispanics or Latinos | 0.0 /100 | #295 | Tragic 26.7% |
| Bangladeshis | 0.0 /100 | #296 | Tragic 26.8% |
| Fijians | 0.0 /100 | #297 | Tragic 27.0% |
| Immigrants | Yemen | 0.0 /100 | #298 | Tragic 27.0% |
| Potawatomi | 0.0 /100 | #299 | Tragic 27.0% |
| Immigrants | Dominican Republic | 0.0 /100 | #300 | Tragic 27.0% |
| Immigrants | Mexico | 0.0 /100 | #301 | Tragic 27.1% |
| Central American Indians | 0.0 /100 | #302 | Tragic 27.1% |
| Tlingit-Haida | 0.0 /100 | #303 | Tragic 27.1% |
| Puget Sound Salish | 0.0 /100 | #304 | Tragic 27.2% |