Immigrants from Somalia vs Bhutanese Male Disability
COMPARE
Immigrants from Somalia
Bhutanese
Male Disability
Male Disability Comparison
Immigrants from Somalia
Bhutanese
11.5%
MALE DISABILITY
10.4/ 100
METRIC RATING
207th/ 347
METRIC RANK
11.0%
MALE DISABILITY
83.4/ 100
METRIC RATING
134th/ 347
METRIC RANK
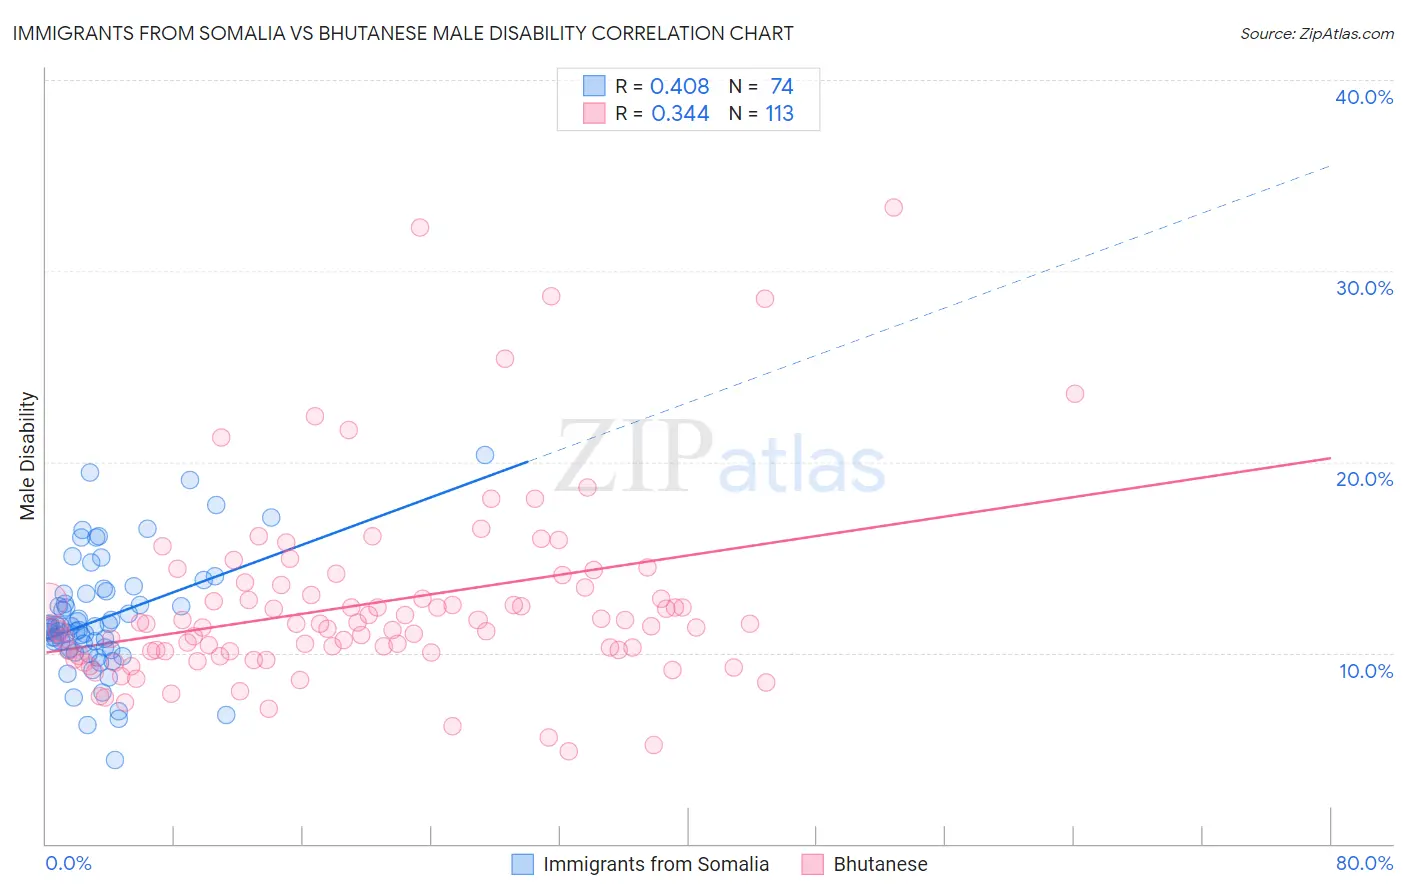
Immigrants from Somalia vs Bhutanese Male Disability Correlation Chart
The statistical analysis conducted on geographies consisting of 92,107,608 people shows a moderate positive correlation between the proportion of Immigrants from Somalia and percentage of males with a disability in the United States with a correlation coefficient (R) of 0.408 and weighted average of 11.5%. Similarly, the statistical analysis conducted on geographies consisting of 455,462,899 people shows a mild positive correlation between the proportion of Bhutanese and percentage of males with a disability in the United States with a correlation coefficient (R) of 0.344 and weighted average of 11.0%, a difference of 5.3%.
Male Disability Correlation Summary
| Measurement | Immigrants from Somalia | Bhutanese |
| Minimum | 4.4% | 4.8% |
| Maximum | 20.4% | 33.3% |
| Range | 16.0% | 28.5% |
| Mean | 11.8% | 12.6% |
| Median | 11.4% | 11.5% |
| Interquartile 25% (IQ1) | 10.2% | 10.1% |
| Interquartile 75% (IQ3) | 13.1% | 13.5% |
| Interquartile Range (IQR) | 2.9% | 3.4% |
| Standard Deviation (Sample) | 3.0% | 5.0% |
| Standard Deviation (Population) | 3.0% | 4.9% |
Similar Demographics by Male Disability
Demographics Similar to Immigrants from Somalia by Male Disability
In terms of male disability, the demographic groups most similar to Immigrants from Somalia are Ukrainian (11.5%, a difference of 0.030%), Serbian (11.5%, a difference of 0.040%), Icelander (11.6%, a difference of 0.040%), Immigrants from Cambodia (11.5%, a difference of 0.050%), and Spanish American Indian (11.6%, a difference of 0.050%).
| Demographics | Rating | Rank | Male Disability |
| Immigrants | Iraq | 13.0 /100 | #200 | Poor 11.5% |
| Immigrants | Panama | 13.0 /100 | #201 | Poor 11.5% |
| Immigrants | Mexico | 12.6 /100 | #202 | Poor 11.5% |
| Jamaicans | 10.9 /100 | #203 | Poor 11.5% |
| Immigrants | Cambodia | 10.8 /100 | #204 | Poor 11.5% |
| Serbians | 10.7 /100 | #205 | Poor 11.5% |
| Ukrainians | 10.6 /100 | #206 | Poor 11.5% |
| Immigrants | Somalia | 10.4 /100 | #207 | Poor 11.5% |
| Icelanders | 10.1 /100 | #208 | Poor 11.6% |
| Spanish American Indians | 10.1 /100 | #209 | Poor 11.6% |
| Ute | 9.4 /100 | #210 | Tragic 11.6% |
| Immigrants | Thailand | 8.4 /100 | #211 | Tragic 11.6% |
| Immigrants | Scotland | 8.2 /100 | #212 | Tragic 11.6% |
| Mexican American Indians | 7.8 /100 | #213 | Tragic 11.6% |
| Lithuanians | 6.6 /100 | #214 | Tragic 11.6% |
Demographics Similar to Bhutanese by Male Disability
In terms of male disability, the demographic groups most similar to Bhutanese are Trinidadian and Tobagonian (11.0%, a difference of 0.010%), Ugandan (11.0%, a difference of 0.050%), Immigrants from Costa Rica (11.0%, a difference of 0.060%), Immigrants from Fiji (11.0%, a difference of 0.070%), and Macedonian (11.0%, a difference of 0.080%).
| Demographics | Rating | Rank | Male Disability |
| Immigrants | Ukraine | 86.8 /100 | #127 | Excellent 10.9% |
| Immigrants | Latvia | 85.5 /100 | #128 | Excellent 10.9% |
| Immigrants | Philippines | 85.4 /100 | #129 | Excellent 10.9% |
| Brazilians | 85.4 /100 | #130 | Excellent 10.9% |
| Macedonians | 84.2 /100 | #131 | Excellent 11.0% |
| Immigrants | Fiji | 84.0 /100 | #132 | Excellent 11.0% |
| Ugandans | 83.9 /100 | #133 | Excellent 11.0% |
| Bhutanese | 83.4 /100 | #134 | Excellent 11.0% |
| Trinidadians and Tobagonians | 83.3 /100 | #135 | Excellent 11.0% |
| Immigrants | Costa Rica | 82.8 /100 | #136 | Excellent 11.0% |
| Immigrants | Europe | 82.0 /100 | #137 | Excellent 11.0% |
| Nigerians | 81.9 /100 | #138 | Excellent 11.0% |
| South Africans | 81.7 /100 | #139 | Excellent 11.0% |
| Immigrants | Italy | 81.5 /100 | #140 | Excellent 11.0% |
| Arabs | 81.5 /100 | #141 | Excellent 11.0% |