Immigrants from Sierra Leone vs Immigrants from Burma/Myanmar Disability Age Over 75
COMPARE
Immigrants from Sierra Leone
Immigrants from Burma/Myanmar
Disability Age Over 75
Disability Age Over 75 Comparison
Immigrants from Sierra Leone
Immigrants from Burma/Myanmar
47.2%
DISABILITY AGE OVER 75
64.4/ 100
METRIC RATING
166th/ 347
METRIC RANK
47.9%
DISABILITY AGE OVER 75
11.7/ 100
METRIC RATING
212th/ 347
METRIC RANK
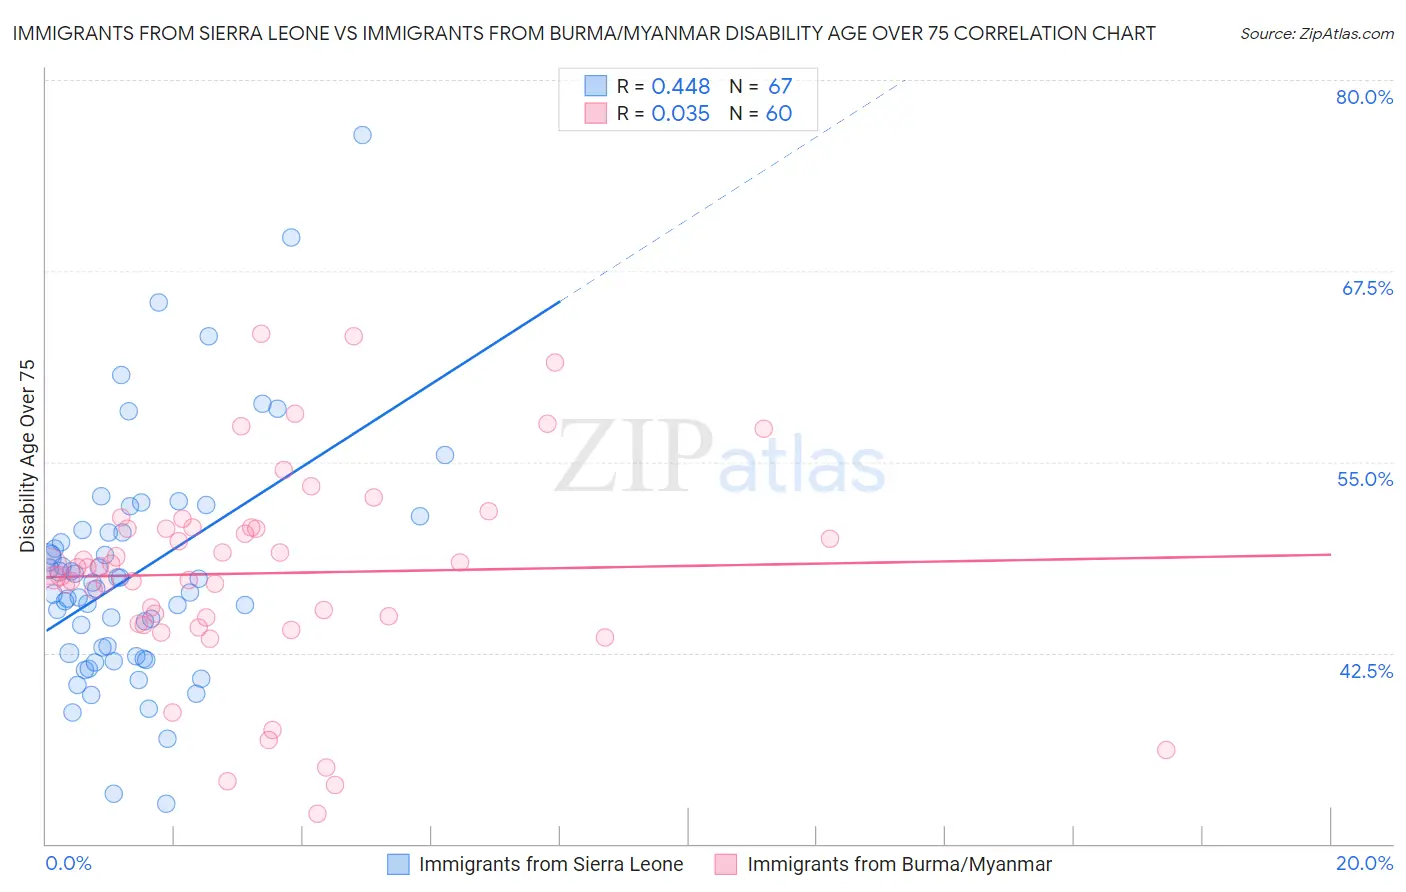
Immigrants from Sierra Leone vs Immigrants from Burma/Myanmar Disability Age Over 75 Correlation Chart
The statistical analysis conducted on geographies consisting of 101,591,179 people shows a moderate positive correlation between the proportion of Immigrants from Sierra Leone and percentage of population with a disability over the age of 75 in the United States with a correlation coefficient (R) of 0.448 and weighted average of 47.2%. Similarly, the statistical analysis conducted on geographies consisting of 172,144,400 people shows no correlation between the proportion of Immigrants from Burma/Myanmar and percentage of population with a disability over the age of 75 in the United States with a correlation coefficient (R) of 0.035 and weighted average of 47.9%, a difference of 1.5%.
Disability Age Over 75 Correlation Summary
| Measurement | Immigrants from Sierra Leone | Immigrants from Burma/Myanmar |
| Minimum | 32.6% | 32.0% |
| Maximum | 76.4% | 63.4% |
| Range | 43.8% | 31.4% |
| Mean | 47.7% | 47.7% |
| Median | 46.7% | 48.1% |
| Interquartile 25% (IQ1) | 42.3% | 44.6% |
| Interquartile 75% (IQ3) | 50.4% | 50.7% |
| Interquartile Range (IQR) | 8.1% | 6.1% |
| Standard Deviation (Sample) | 7.8% | 6.7% |
| Standard Deviation (Population) | 7.7% | 6.6% |
Similar Demographics by Disability Age Over 75
Demographics Similar to Immigrants from Sierra Leone by Disability Age Over 75
In terms of disability age over 75, the demographic groups most similar to Immigrants from Sierra Leone are Immigrants from Zimbabwe (47.2%, a difference of 0.0%), French (47.2%, a difference of 0.010%), Immigrants from Eastern Africa (47.2%, a difference of 0.030%), Pennsylvania German (47.2%, a difference of 0.040%), and Moroccan (47.2%, a difference of 0.040%).
| Demographics | Rating | Rank | Disability Age Over 75 |
| Immigrants | Morocco | 71.4 /100 | #159 | Good 47.1% |
| Immigrants | Middle Africa | 68.3 /100 | #160 | Good 47.1% |
| South American Indians | 68.1 /100 | #161 | Good 47.1% |
| Pennsylvania Germans | 66.0 /100 | #162 | Good 47.2% |
| Immigrants | Eastern Africa | 65.5 /100 | #163 | Good 47.2% |
| French | 64.6 /100 | #164 | Good 47.2% |
| Immigrants | Zimbabwe | 64.4 /100 | #165 | Good 47.2% |
| Immigrants | Sierra Leone | 64.4 /100 | #166 | Good 47.2% |
| Moroccans | 62.9 /100 | #167 | Good 47.2% |
| Kenyans | 58.8 /100 | #168 | Average 47.2% |
| Celtics | 58.7 /100 | #169 | Average 47.2% |
| German Russians | 56.2 /100 | #170 | Average 47.3% |
| Immigrants | Africa | 53.6 /100 | #171 | Average 47.3% |
| Scotch-Irish | 52.5 /100 | #172 | Average 47.3% |
| Alsatians | 51.9 /100 | #173 | Average 47.3% |
Demographics Similar to Immigrants from Burma/Myanmar by Disability Age Over 75
In terms of disability age over 75, the demographic groups most similar to Immigrants from Burma/Myanmar are Panamanian (47.9%, a difference of 0.0%), Vietnamese (47.9%, a difference of 0.010%), Laotian (47.9%, a difference of 0.010%), Immigrants from Barbados (47.9%, a difference of 0.060%), and Senegalese (47.9%, a difference of 0.060%).
| Demographics | Rating | Rank | Disability Age Over 75 |
| Immigrants | Ghana | 19.1 /100 | #205 | Poor 47.7% |
| Jamaicans | 19.0 /100 | #206 | Poor 47.7% |
| Immigrants | Syria | 17.4 /100 | #207 | Poor 47.8% |
| Immigrants | Senegal | 16.9 /100 | #208 | Poor 47.8% |
| Immigrants | Indonesia | 14.2 /100 | #209 | Poor 47.8% |
| Vietnamese | 11.9 /100 | #210 | Poor 47.9% |
| Panamanians | 11.8 /100 | #211 | Poor 47.9% |
| Immigrants | Burma/Myanmar | 11.7 /100 | #212 | Poor 47.9% |
| Laotians | 11.5 /100 | #213 | Poor 47.9% |
| Immigrants | Barbados | 10.7 /100 | #214 | Poor 47.9% |
| Senegalese | 10.7 /100 | #215 | Poor 47.9% |
| Immigrants | Panama | 10.2 /100 | #216 | Poor 47.9% |
| Immigrants | Grenada | 9.4 /100 | #217 | Tragic 47.9% |
| Immigrants | Western Africa | 8.3 /100 | #218 | Tragic 48.0% |
| Immigrants | Western Asia | 7.5 /100 | #219 | Tragic 48.0% |