Immigrants from Sierra Leone vs Immigrants from Peru Disability Age Over 75
COMPARE
Immigrants from Sierra Leone
Immigrants from Peru
Disability Age Over 75
Disability Age Over 75 Comparison
Immigrants from Sierra Leone
Immigrants from Peru
47.2%
DISABILITY AGE OVER 75
64.4/ 100
METRIC RATING
166th/ 347
METRIC RANK
46.9%
DISABILITY AGE OVER 75
84.1/ 100
METRIC RATING
147th/ 347
METRIC RANK
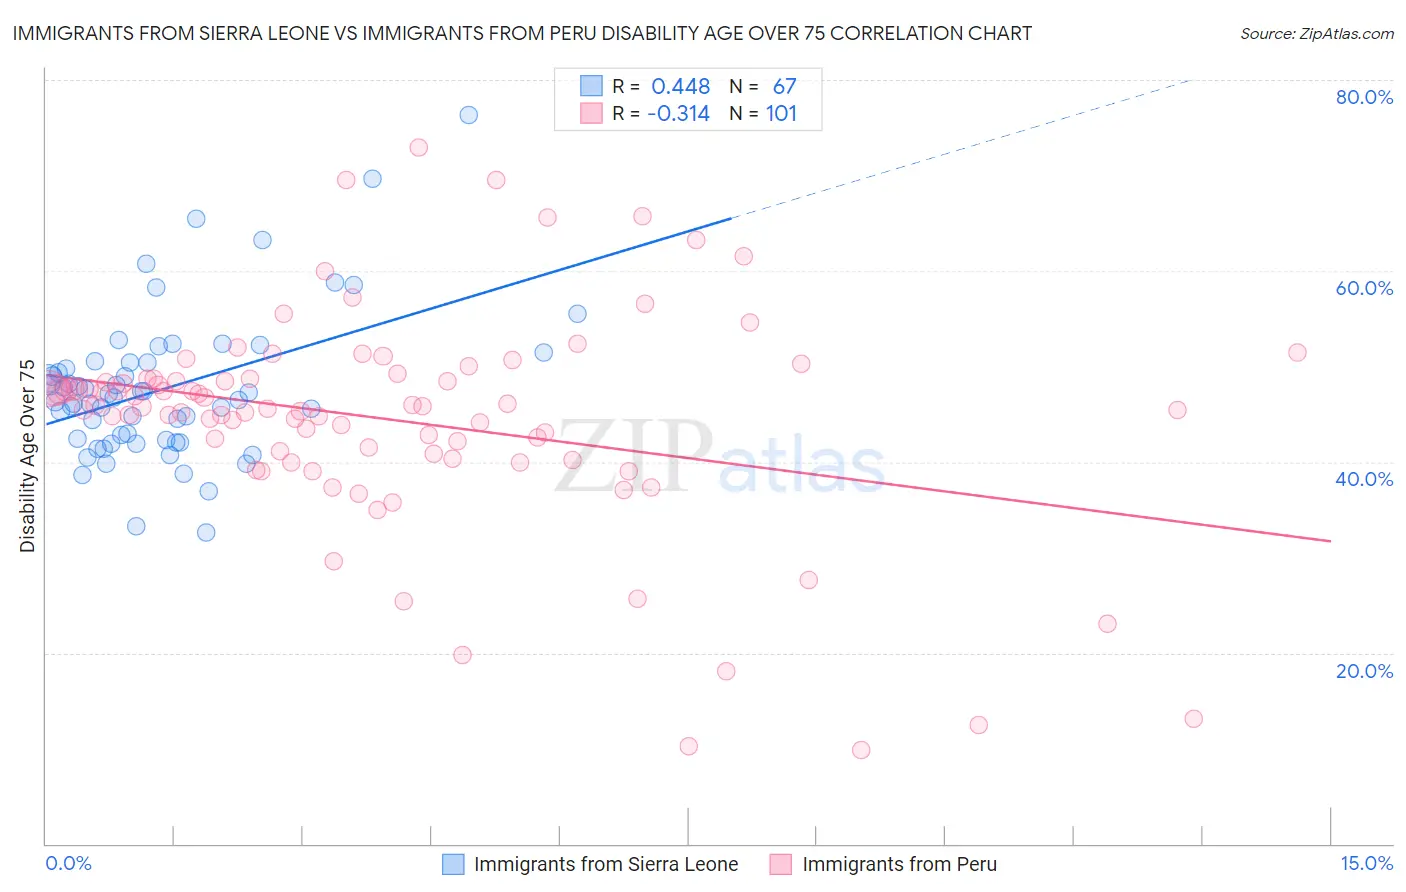
Immigrants from Sierra Leone vs Immigrants from Peru Disability Age Over 75 Correlation Chart
The statistical analysis conducted on geographies consisting of 101,591,179 people shows a moderate positive correlation between the proportion of Immigrants from Sierra Leone and percentage of population with a disability over the age of 75 in the United States with a correlation coefficient (R) of 0.448 and weighted average of 47.2%. Similarly, the statistical analysis conducted on geographies consisting of 328,503,391 people shows a mild negative correlation between the proportion of Immigrants from Peru and percentage of population with a disability over the age of 75 in the United States with a correlation coefficient (R) of -0.314 and weighted average of 46.9%, a difference of 0.61%.
Disability Age Over 75 Correlation Summary
| Measurement | Immigrants from Sierra Leone | Immigrants from Peru |
| Minimum | 32.6% | 9.9% |
| Maximum | 76.4% | 73.0% |
| Range | 43.8% | 63.1% |
| Mean | 47.7% | 44.5% |
| Median | 46.7% | 45.8% |
| Interquartile 25% (IQ1) | 42.3% | 40.6% |
| Interquartile 75% (IQ3) | 50.4% | 48.7% |
| Interquartile Range (IQR) | 8.1% | 8.1% |
| Standard Deviation (Sample) | 7.8% | 11.5% |
| Standard Deviation (Population) | 7.7% | 11.4% |
Demographics Similar to Immigrants from Sierra Leone and Immigrants from Peru by Disability Age Over 75
In terms of disability age over 75, the demographic groups most similar to Immigrants from Sierra Leone are Immigrants from Zimbabwe (47.2%, a difference of 0.0%), French (47.2%, a difference of 0.010%), Immigrants from Eastern Africa (47.2%, a difference of 0.030%), Pennsylvania German (47.2%, a difference of 0.040%), and South American Indian (47.1%, a difference of 0.090%). Similarly, the demographic groups most similar to Immigrants from Peru are Guyanese (46.9%, a difference of 0.010%), Asian (46.9%, a difference of 0.10%), Welsh (47.0%, a difference of 0.11%), Immigrants from Russia (47.0%, a difference of 0.18%), and French Canadian (47.0%, a difference of 0.19%).
| Demographics | Rating | Rank | Disability Age Over 75 |
| Guyanese | 84.3 /100 | #146 | Excellent 46.9% |
| Immigrants | Peru | 84.1 /100 | #147 | Excellent 46.9% |
| Asians | 81.6 /100 | #148 | Excellent 46.9% |
| Welsh | 81.3 /100 | #149 | Excellent 47.0% |
| Immigrants | Russia | 79.3 /100 | #150 | Good 47.0% |
| French Canadians | 79.0 /100 | #151 | Good 47.0% |
| Immigrants | Asia | 76.5 /100 | #152 | Good 47.0% |
| Immigrants | Zaire | 74.8 /100 | #153 | Good 47.1% |
| Immigrants | Belarus | 74.8 /100 | #154 | Good 47.1% |
| Immigrants | Iran | 74.7 /100 | #155 | Good 47.1% |
| Arabs | 73.3 /100 | #156 | Good 47.1% |
| Bhutanese | 72.6 /100 | #157 | Good 47.1% |
| Immigrants | Guyana | 71.9 /100 | #158 | Good 47.1% |
| Immigrants | Morocco | 71.4 /100 | #159 | Good 47.1% |
| Immigrants | Middle Africa | 68.3 /100 | #160 | Good 47.1% |
| South American Indians | 68.1 /100 | #161 | Good 47.1% |
| Pennsylvania Germans | 66.0 /100 | #162 | Good 47.2% |
| Immigrants | Eastern Africa | 65.5 /100 | #163 | Good 47.2% |
| French | 64.6 /100 | #164 | Good 47.2% |
| Immigrants | Zimbabwe | 64.4 /100 | #165 | Good 47.2% |
| Immigrants | Sierra Leone | 64.4 /100 | #166 | Good 47.2% |