Immigrants from Serbia vs Carpatho Rusyn Disability Age 35 to 64
COMPARE
Immigrants from Serbia
Carpatho Rusyn
Disability Age 35 to 64
Disability Age 35 to 64 Comparison
Immigrants from Serbia
Carpatho Rusyns
9.8%
DISABILITY AGE 35 TO 64
99.8/ 100
METRIC RATING
48th/ 347
METRIC RANK
11.5%
DISABILITY AGE 35 TO 64
25.3/ 100
METRIC RATING
195th/ 347
METRIC RANK
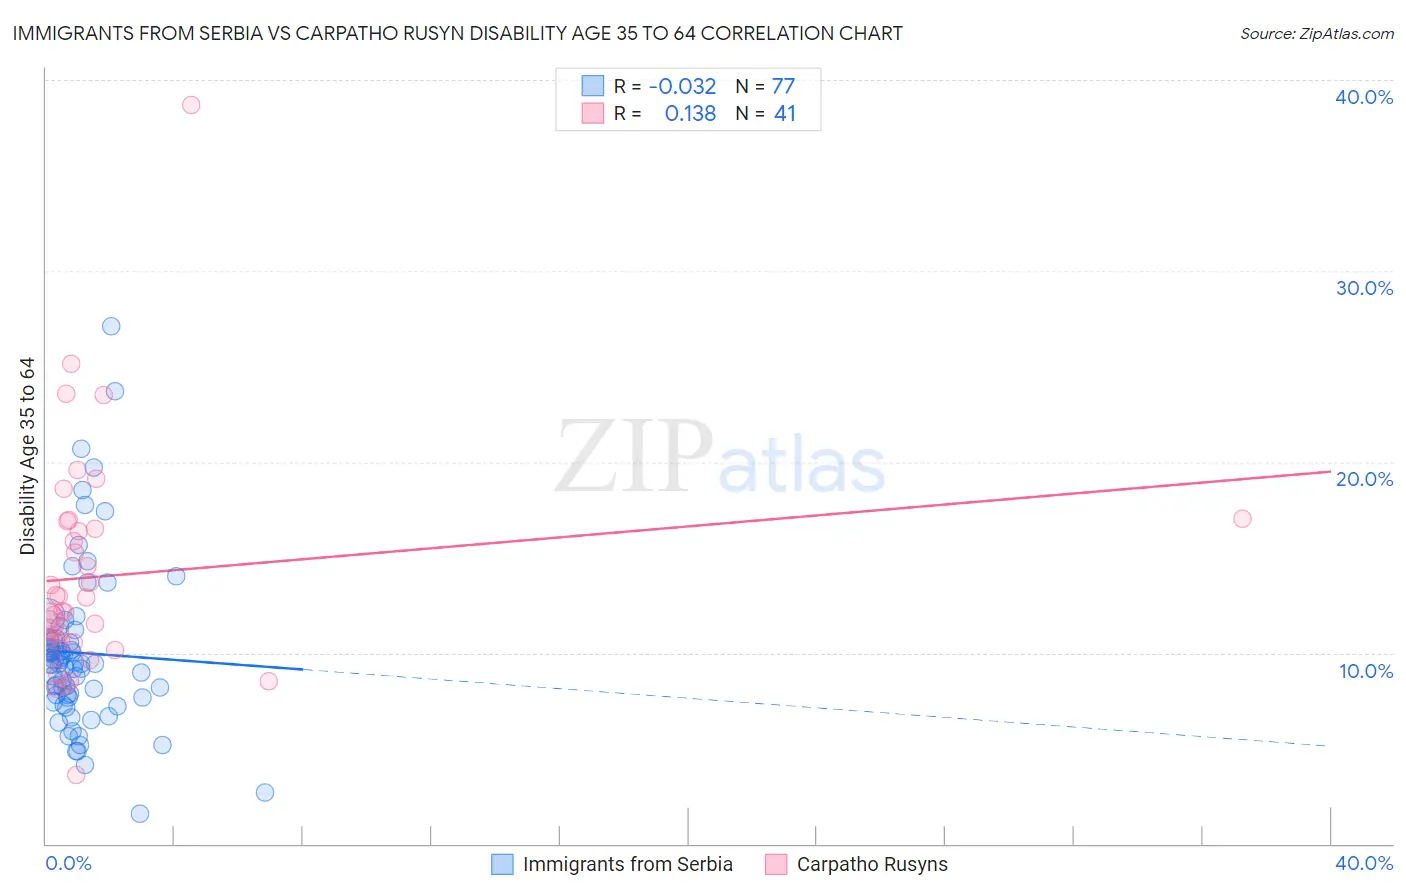
Immigrants from Serbia vs Carpatho Rusyn Disability Age 35 to 64 Correlation Chart
The statistical analysis conducted on geographies consisting of 131,722,844 people shows no correlation between the proportion of Immigrants from Serbia and percentage of population with a disability between the ages 34 and 64 in the United States with a correlation coefficient (R) of -0.032 and weighted average of 9.8%. Similarly, the statistical analysis conducted on geographies consisting of 58,871,605 people shows a poor positive correlation between the proportion of Carpatho Rusyns and percentage of population with a disability between the ages 34 and 64 in the United States with a correlation coefficient (R) of 0.138 and weighted average of 11.5%, a difference of 17.3%.
Disability Age 35 to 64 Correlation Summary
| Measurement | Immigrants from Serbia | Carpatho Rusyn |
| Minimum | 1.6% | 3.6% |
| Maximum | 27.1% | 38.7% |
| Range | 25.5% | 35.0% |
| Mean | 10.0% | 14.0% |
| Median | 9.4% | 12.2% |
| Interquartile 25% (IQ1) | 7.7% | 10.6% |
| Interquartile 75% (IQ3) | 10.7% | 16.7% |
| Interquartile Range (IQR) | 3.0% | 6.1% |
| Standard Deviation (Sample) | 4.4% | 6.0% |
| Standard Deviation (Population) | 4.4% | 5.9% |
Similar Demographics by Disability Age 35 to 64
Demographics Similar to Immigrants from Serbia by Disability Age 35 to 64
In terms of disability age 35 to 64, the demographic groups most similar to Immigrants from Serbia are Immigrants from Belgium (9.8%, a difference of 0.010%), Immigrants from Greece (9.8%, a difference of 0.040%), Cambodian (9.8%, a difference of 0.060%), Paraguayan (9.8%, a difference of 0.11%), and Bhutanese (9.8%, a difference of 0.20%).
| Demographics | Rating | Rank | Disability Age 35 to 64 |
| Israelis | 99.9 /100 | #41 | Exceptional 9.7% |
| Immigrants | Malaysia | 99.9 /100 | #42 | Exceptional 9.7% |
| Immigrants | Colombia | 99.9 /100 | #43 | Exceptional 9.8% |
| Immigrants | Egypt | 99.9 /100 | #44 | Exceptional 9.8% |
| Immigrants | Peru | 99.9 /100 | #45 | Exceptional 9.8% |
| Cambodians | 99.8 /100 | #46 | Exceptional 9.8% |
| Immigrants | Belgium | 99.8 /100 | #47 | Exceptional 9.8% |
| Immigrants | Serbia | 99.8 /100 | #48 | Exceptional 9.8% |
| Immigrants | Greece | 99.8 /100 | #49 | Exceptional 9.8% |
| Paraguayans | 99.8 /100 | #50 | Exceptional 9.8% |
| Bhutanese | 99.8 /100 | #51 | Exceptional 9.8% |
| Immigrants | Bulgaria | 99.8 /100 | #52 | Exceptional 9.8% |
| Taiwanese | 99.8 /100 | #53 | Exceptional 9.8% |
| Immigrants | Russia | 99.8 /100 | #54 | Exceptional 9.8% |
| Peruvians | 99.8 /100 | #55 | Exceptional 9.9% |
Demographics Similar to Carpatho Rusyns by Disability Age 35 to 64
In terms of disability age 35 to 64, the demographic groups most similar to Carpatho Rusyns are Iraqi (11.5%, a difference of 0.12%), Immigrants from Latin America (11.5%, a difference of 0.22%), Immigrants from Africa (11.5%, a difference of 0.37%), Norwegian (11.5%, a difference of 0.43%), and Immigrants from Iraq (11.6%, a difference of 0.48%).
| Demographics | Rating | Rank | Disability Age 35 to 64 |
| Northern Europeans | 34.9 /100 | #188 | Fair 11.4% |
| Hungarians | 34.6 /100 | #189 | Fair 11.4% |
| Immigrants | Nigeria | 32.5 /100 | #190 | Fair 11.4% |
| Swedes | 31.3 /100 | #191 | Fair 11.4% |
| Norwegians | 29.7 /100 | #192 | Fair 11.5% |
| Immigrants | Africa | 29.0 /100 | #193 | Fair 11.5% |
| Immigrants | Latin America | 27.5 /100 | #194 | Fair 11.5% |
| Carpatho Rusyns | 25.3 /100 | #195 | Fair 11.5% |
| Iraqis | 24.2 /100 | #196 | Fair 11.5% |
| Immigrants | Iraq | 21.0 /100 | #197 | Fair 11.6% |
| Immigrants | Panama | 20.4 /100 | #198 | Fair 11.6% |
| Basques | 19.5 /100 | #199 | Poor 11.6% |
| Swiss | 18.7 /100 | #200 | Poor 11.6% |
| Immigrants | Kenya | 17.7 /100 | #201 | Poor 11.6% |
| Immigrants | Guatemala | 17.5 /100 | #202 | Poor 11.6% |