Immigrants from Serbia vs Carpatho Rusyn Unemployment Among Ages 20 to 24 years
COMPARE
Immigrants from Serbia
Carpatho Rusyn
Unemployment Among Ages 20 to 24 years
Unemployment Among Ages 20 to 24 years Comparison
Immigrants from Serbia
Carpatho Rusyns
9.8%
UNEMPLOYMENT AMONG AGES 20 TO 24 YEARS
99.6/ 100
METRIC RATING
53rd/ 347
METRIC RANK
9.8%
UNEMPLOYMENT AMONG AGES 20 TO 24 YEARS
99.6/ 100
METRIC RATING
55th/ 347
METRIC RANK
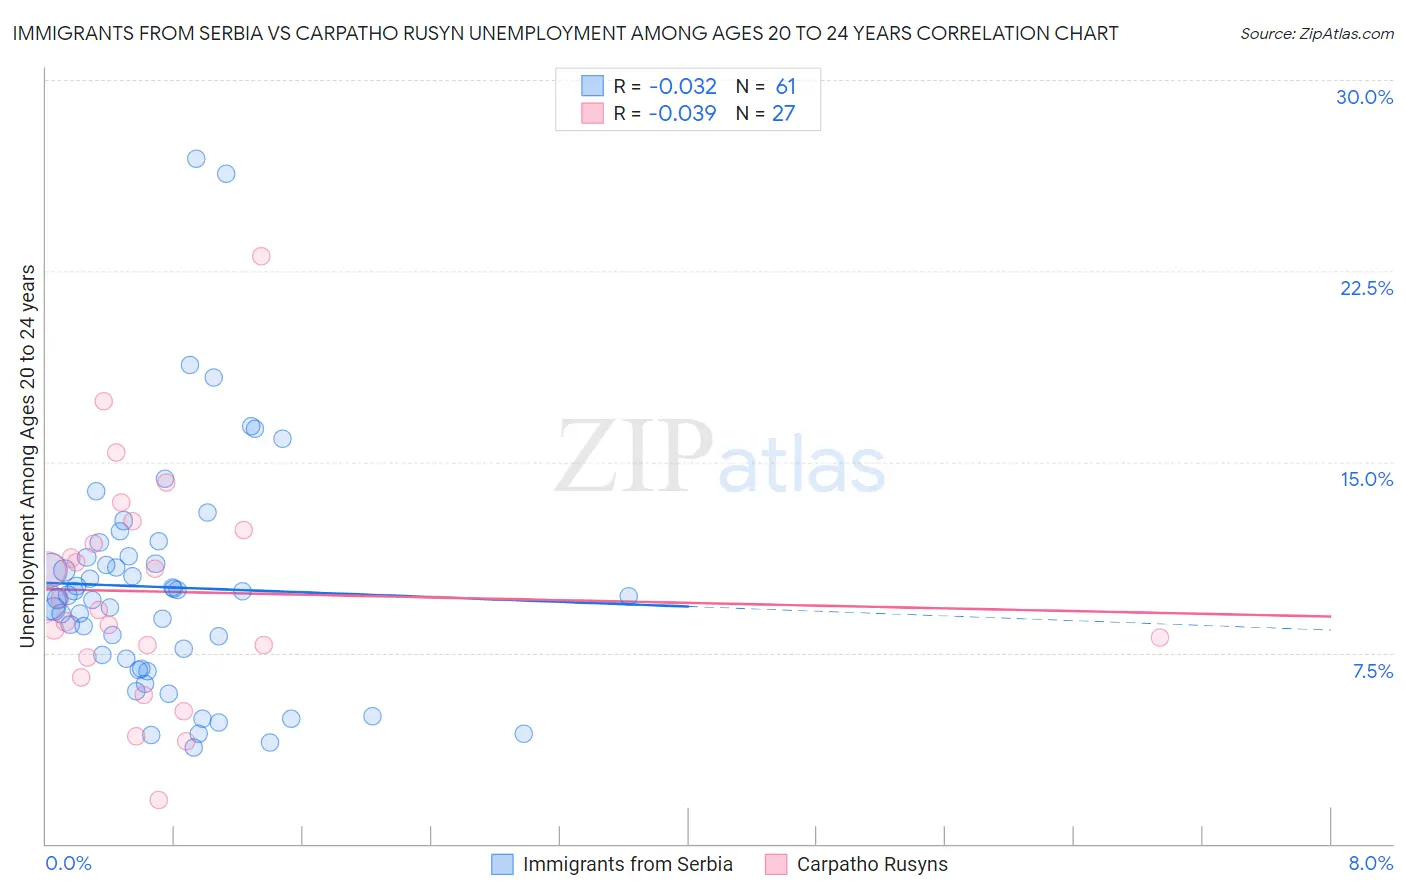
Immigrants from Serbia vs Carpatho Rusyn Unemployment Among Ages 20 to 24 years Correlation Chart
The statistical analysis conducted on geographies consisting of 130,318,042 people shows no correlation between the proportion of Immigrants from Serbia and unemployment rate among population between the ages 20 and 24 in the United States with a correlation coefficient (R) of -0.032 and weighted average of 9.8%. Similarly, the statistical analysis conducted on geographies consisting of 58,204,618 people shows no correlation between the proportion of Carpatho Rusyns and unemployment rate among population between the ages 20 and 24 in the United States with a correlation coefficient (R) of -0.039 and weighted average of 9.8%, a difference of 0.16%.
Unemployment Among Ages 20 to 24 years Correlation Summary
| Measurement | Immigrants from Serbia | Carpatho Rusyn |
| Minimum | 3.8% | 1.7% |
| Maximum | 26.9% | 23.1% |
| Range | 23.1% | 21.4% |
| Mean | 10.1% | 9.9% |
| Median | 9.7% | 9.2% |
| Interquartile 25% (IQ1) | 7.1% | 7.3% |
| Interquartile 75% (IQ3) | 11.3% | 12.3% |
| Interquartile Range (IQR) | 4.2% | 5.0% |
| Standard Deviation (Sample) | 4.6% | 4.5% |
| Standard Deviation (Population) | 4.6% | 4.4% |
Demographics Similar to Immigrants from Serbia and Carpatho Rusyns by Unemployment Among Ages 20 to 24 years
In terms of unemployment among ages 20 to 24 years, the demographic groups most similar to Immigrants from Serbia are Immigrants from Cambodia (9.8%, a difference of 0.040%), Immigrants from Thailand (9.8%, a difference of 0.11%), Nicaraguan (9.8%, a difference of 0.17%), Ethiopian (9.8%, a difference of 0.22%), and Immigrants from Kenya (9.7%, a difference of 0.29%). Similarly, the demographic groups most similar to Carpatho Rusyns are Nicaraguan (9.8%, a difference of 0.010%), Immigrants from Cambodia (9.8%, a difference of 0.13%), Immigrants from Moldova (9.8%, a difference of 0.16%), Pakistani (9.8%, a difference of 0.20%), and English (9.8%, a difference of 0.21%).
| Demographics | Rating | Rank | Unemployment Among Ages 20 to 24 years |
| Europeans | 99.8 /100 | #44 | Exceptional 9.7% |
| Croatians | 99.8 /100 | #45 | Exceptional 9.7% |
| Immigrants | Nicaragua | 99.8 /100 | #46 | Exceptional 9.7% |
| Immigrants | India | 99.8 /100 | #47 | Exceptional 9.7% |
| Finns | 99.8 /100 | #48 | Exceptional 9.7% |
| Creek | 99.8 /100 | #49 | Exceptional 9.7% |
| Immigrants | Kenya | 99.7 /100 | #50 | Exceptional 9.7% |
| Ethiopians | 99.7 /100 | #51 | Exceptional 9.8% |
| Immigrants | Thailand | 99.7 /100 | #52 | Exceptional 9.8% |
| Immigrants | Serbia | 99.6 /100 | #53 | Exceptional 9.8% |
| Immigrants | Cambodia | 99.6 /100 | #54 | Exceptional 9.8% |
| Carpatho Rusyns | 99.6 /100 | #55 | Exceptional 9.8% |
| Nicaraguans | 99.6 /100 | #56 | Exceptional 9.8% |
| Immigrants | Moldova | 99.5 /100 | #57 | Exceptional 9.8% |
| Pakistanis | 99.5 /100 | #58 | Exceptional 9.8% |
| English | 99.5 /100 | #59 | Exceptional 9.8% |
| Immigrants | Kuwait | 99.5 /100 | #60 | Exceptional 9.8% |
| Malaysians | 99.5 /100 | #61 | Exceptional 9.8% |
| Immigrants | Singapore | 99.4 /100 | #62 | Exceptional 9.8% |
| British | 99.4 /100 | #63 | Exceptional 9.8% |
| Serbians | 99.4 /100 | #64 | Exceptional 9.8% |