Immigrants from Serbia vs Carpatho Rusyn Female Unemployment
COMPARE
Immigrants from Serbia
Carpatho Rusyn
Female Unemployment
Female Unemployment Comparison
Immigrants from Serbia
Carpatho Rusyns
5.0%
FEMALE UNEMPLOYMENT
97.2/ 100
METRIC RATING
83rd/ 347
METRIC RANK
4.7%
FEMALE UNEMPLOYMENT
99.9/ 100
METRIC RATING
16th/ 347
METRIC RANK
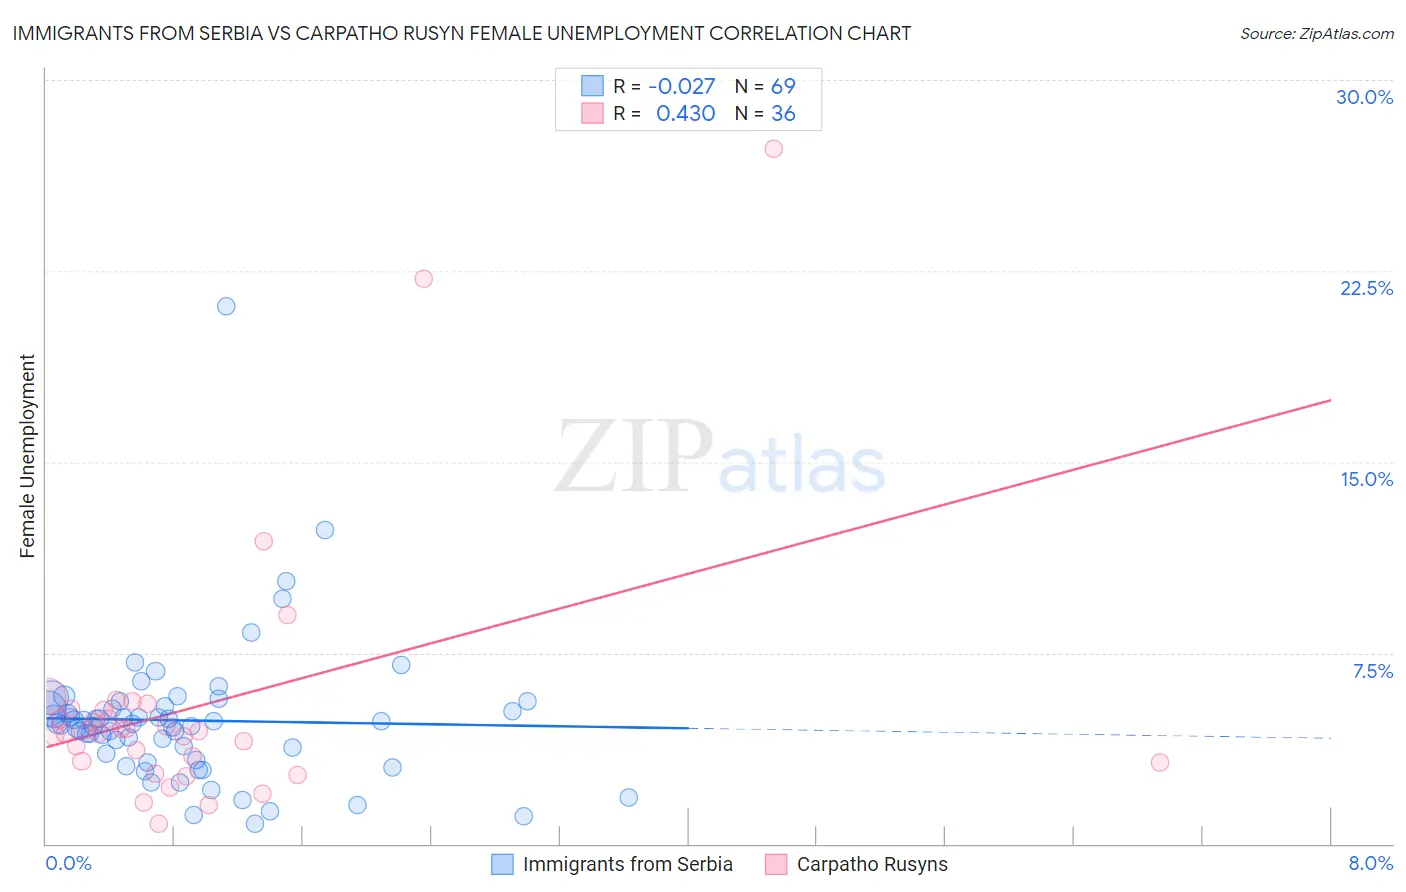
Immigrants from Serbia vs Carpatho Rusyn Female Unemployment Correlation Chart
The statistical analysis conducted on geographies consisting of 131,575,347 people shows no correlation between the proportion of Immigrants from Serbia and unemploymnet rate among females in the United States with a correlation coefficient (R) of -0.027 and weighted average of 5.0%. Similarly, the statistical analysis conducted on geographies consisting of 58,788,247 people shows a moderate positive correlation between the proportion of Carpatho Rusyns and unemploymnet rate among females in the United States with a correlation coefficient (R) of 0.430 and weighted average of 4.7%, a difference of 6.5%.
Female Unemployment Correlation Summary
| Measurement | Immigrants from Serbia | Carpatho Rusyn |
| Minimum | 0.80% | 0.80% |
| Maximum | 21.1% | 27.3% |
| Range | 20.3% | 26.5% |
| Mean | 4.8% | 5.4% |
| Median | 4.7% | 4.4% |
| Interquartile 25% (IQ1) | 3.4% | 3.2% |
| Interquartile 75% (IQ3) | 5.4% | 5.3% |
| Interquartile Range (IQR) | 1.9% | 2.1% |
| Standard Deviation (Sample) | 2.8% | 5.2% |
| Standard Deviation (Population) | 2.8% | 5.1% |
Similar Demographics by Female Unemployment
Demographics Similar to Immigrants from Serbia by Female Unemployment
In terms of female unemployment, the demographic groups most similar to Immigrants from Serbia are Immigrants from Australia (5.0%, a difference of 0.020%), Canadian (5.0%, a difference of 0.040%), Filipino (5.0%, a difference of 0.070%), Ukrainian (5.0%, a difference of 0.080%), and New Zealander (5.0%, a difference of 0.090%).
| Demographics | Rating | Rank | Female Unemployment |
| Immigrants | Venezuela | 97.9 /100 | #76 | Exceptional 5.0% |
| Mongolians | 97.8 /100 | #77 | Exceptional 5.0% |
| Immigrants | Netherlands | 97.8 /100 | #78 | Exceptional 5.0% |
| Turks | 97.6 /100 | #79 | Exceptional 5.0% |
| New Zealanders | 97.4 /100 | #80 | Exceptional 5.0% |
| Filipinos | 97.3 /100 | #81 | Exceptional 5.0% |
| Immigrants | Australia | 97.3 /100 | #82 | Exceptional 5.0% |
| Immigrants | Serbia | 97.2 /100 | #83 | Exceptional 5.0% |
| Canadians | 97.2 /100 | #84 | Exceptional 5.0% |
| Ukrainians | 97.1 /100 | #85 | Exceptional 5.0% |
| Bolivians | 97.1 /100 | #86 | Exceptional 5.0% |
| Venezuelans | 96.9 /100 | #87 | Exceptional 5.0% |
| Immigrants | Sudan | 96.7 /100 | #88 | Exceptional 5.0% |
| Immigrants | Taiwan | 96.6 /100 | #89 | Exceptional 5.0% |
| Immigrants | Sweden | 96.3 /100 | #90 | Exceptional 5.0% |
Demographics Similar to Carpatho Rusyns by Female Unemployment
In terms of female unemployment, the demographic groups most similar to Carpatho Rusyns are Croatian (4.7%, a difference of 0.020%), Latvian (4.7%, a difference of 0.16%), Polish (4.7%, a difference of 0.17%), Bulgarian (4.7%, a difference of 0.25%), and Fijian (4.7%, a difference of 0.27%).
| Demographics | Rating | Rank | Female Unemployment |
| Slovenes | 100.0 /100 | #9 | Exceptional 4.5% |
| Swiss | 100.0 /100 | #10 | Exceptional 4.6% |
| Scandinavians | 100.0 /100 | #11 | Exceptional 4.6% |
| Dutch | 100.0 /100 | #12 | Exceptional 4.6% |
| Belgians | 100.0 /100 | #13 | Exceptional 4.6% |
| Finns | 100.0 /100 | #14 | Exceptional 4.6% |
| English | 100.0 /100 | #15 | Exceptional 4.6% |
| Carpatho Rusyns | 99.9 /100 | #16 | Exceptional 4.7% |
| Croatians | 99.9 /100 | #17 | Exceptional 4.7% |
| Latvians | 99.9 /100 | #18 | Exceptional 4.7% |
| Poles | 99.9 /100 | #19 | Exceptional 4.7% |
| Bulgarians | 99.9 /100 | #20 | Exceptional 4.7% |
| Fijians | 99.9 /100 | #21 | Exceptional 4.7% |
| Europeans | 99.9 /100 | #22 | Exceptional 4.7% |
| Scottish | 99.9 /100 | #23 | Exceptional 4.7% |