Panamanian vs Turkish Hearing Disability
COMPARE
Panamanian
Turkish
Hearing Disability
Hearing Disability Comparison
Panamanians
Turks
3.0%
HEARING DISABILITY
47.0/ 100
METRIC RATING
176th/ 347
METRIC RANK
2.8%
HEARING DISABILITY
93.0/ 100
METRIC RATING
109th/ 347
METRIC RANK
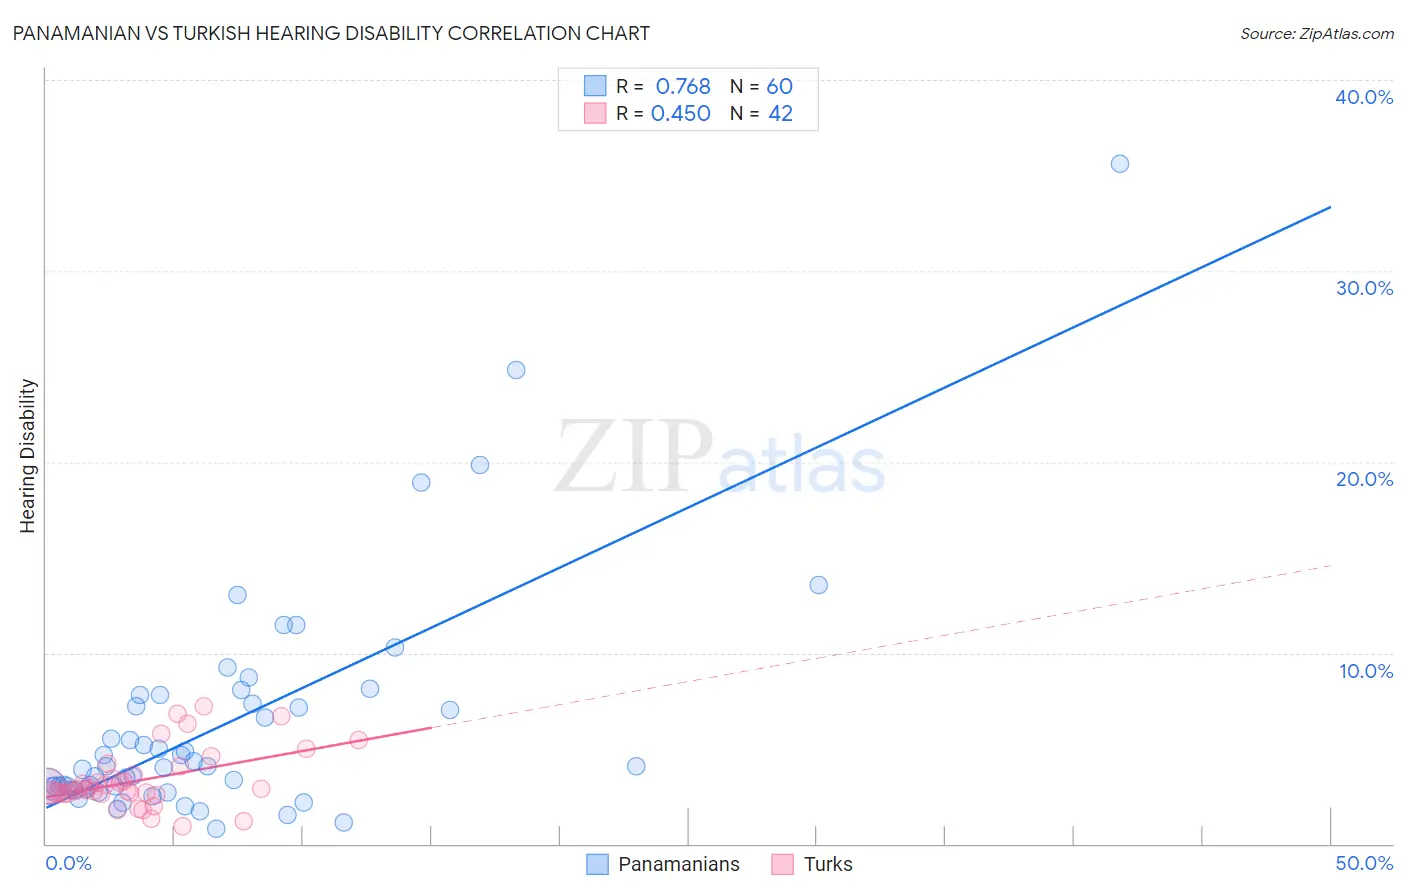
Panamanian vs Turkish Hearing Disability Correlation Chart
The statistical analysis conducted on geographies consisting of 281,114,071 people shows a strong positive correlation between the proportion of Panamanians and percentage of population with hearing disability in the United States with a correlation coefficient (R) of 0.768 and weighted average of 3.0%. Similarly, the statistical analysis conducted on geographies consisting of 271,814,668 people shows a moderate positive correlation between the proportion of Turks and percentage of population with hearing disability in the United States with a correlation coefficient (R) of 0.450 and weighted average of 2.8%, a difference of 6.8%.
Hearing Disability Correlation Summary
| Measurement | Panamanian | Turkish |
| Minimum | 0.76% | 0.92% |
| Maximum | 35.6% | 7.2% |
| Range | 34.9% | 6.3% |
| Mean | 6.2% | 3.3% |
| Median | 4.0% | 2.9% |
| Interquartile 25% (IQ1) | 2.9% | 2.7% |
| Interquartile 75% (IQ3) | 7.6% | 3.6% |
| Interquartile Range (IQR) | 4.7% | 0.93% |
| Standard Deviation (Sample) | 6.1% | 1.5% |
| Standard Deviation (Population) | 6.0% | 1.5% |
Similar Demographics by Hearing Disability
Demographics Similar to Panamanians by Hearing Disability
In terms of hearing disability, the demographic groups most similar to Panamanians are Immigrants from Philippines (3.0%, a difference of 0.060%), Japanese (3.0%, a difference of 0.10%), Immigrants from Romania (3.0%, a difference of 0.14%), Indonesian (3.0%, a difference of 0.28%), and Immigrants from Moldova (3.0%, a difference of 0.37%).
| Demographics | Rating | Rank | Hearing Disability |
| Arabs | 57.6 /100 | #169 | Average 3.0% |
| Immigrants | Cabo Verde | 56.9 /100 | #170 | Average 3.0% |
| Immigrants | Ukraine | 56.6 /100 | #171 | Average 3.0% |
| Armenians | 56.0 /100 | #172 | Average 3.0% |
| Immigrants | Serbia | 51.1 /100 | #173 | Average 3.0% |
| Indonesians | 50.0 /100 | #174 | Average 3.0% |
| Immigrants | Romania | 48.4 /100 | #175 | Average 3.0% |
| Panamanians | 47.0 /100 | #176 | Average 3.0% |
| Immigrants | Philippines | 46.4 /100 | #177 | Average 3.0% |
| Japanese | 46.0 /100 | #178 | Average 3.0% |
| Immigrants | Moldova | 43.1 /100 | #179 | Average 3.0% |
| Immigrants | Sweden | 42.4 /100 | #180 | Average 3.0% |
| Immigrants | Belgium | 41.5 /100 | #181 | Average 3.0% |
| Immigrants | Italy | 41.1 /100 | #182 | Average 3.0% |
| Bulgarians | 39.7 /100 | #183 | Fair 3.0% |
Demographics Similar to Turks by Hearing Disability
In terms of hearing disability, the demographic groups most similar to Turks are Cypriot (2.8%, a difference of 0.050%), Guatemalan (2.8%, a difference of 0.070%), Immigrants from Yemen (2.8%, a difference of 0.10%), Honduran (2.8%, a difference of 0.15%), and Immigrants from Chile (2.8%, a difference of 0.15%).
| Demographics | Rating | Rank | Hearing Disability |
| Taiwanese | 94.8 /100 | #102 | Exceptional 2.8% |
| Immigrants | Indonesia | 94.7 /100 | #103 | Exceptional 2.8% |
| Burmese | 94.2 /100 | #104 | Exceptional 2.8% |
| Moroccans | 93.9 /100 | #105 | Exceptional 2.8% |
| Hondurans | 93.4 /100 | #106 | Exceptional 2.8% |
| Immigrants | Chile | 93.4 /100 | #107 | Exceptional 2.8% |
| Guatemalans | 93.2 /100 | #108 | Exceptional 2.8% |
| Turks | 93.0 /100 | #109 | Exceptional 2.8% |
| Cypriots | 92.9 /100 | #110 | Exceptional 2.8% |
| Immigrants | Yemen | 92.7 /100 | #111 | Exceptional 2.8% |
| U.S. Virgin Islanders | 92.5 /100 | #112 | Exceptional 2.8% |
| Immigrants | Belarus | 91.6 /100 | #113 | Exceptional 2.8% |
| Cambodians | 91.1 /100 | #114 | Exceptional 2.8% |
| Immigrants | Latin America | 90.5 /100 | #115 | Exceptional 2.8% |
| Immigrants | Immigrants | 90.3 /100 | #116 | Exceptional 2.8% |