Immigrants from Russia vs Greek Vision Disability
COMPARE
Immigrants from Russia
Greek
Vision Disability
Vision Disability Comparison
Immigrants from Russia
Greeks
2.0%
VISION DISABILITY
99.1/ 100
METRIC RATING
62nd/ 347
METRIC RANK
2.1%
VISION DISABILITY
95.1/ 100
METRIC RATING
100th/ 347
METRIC RANK
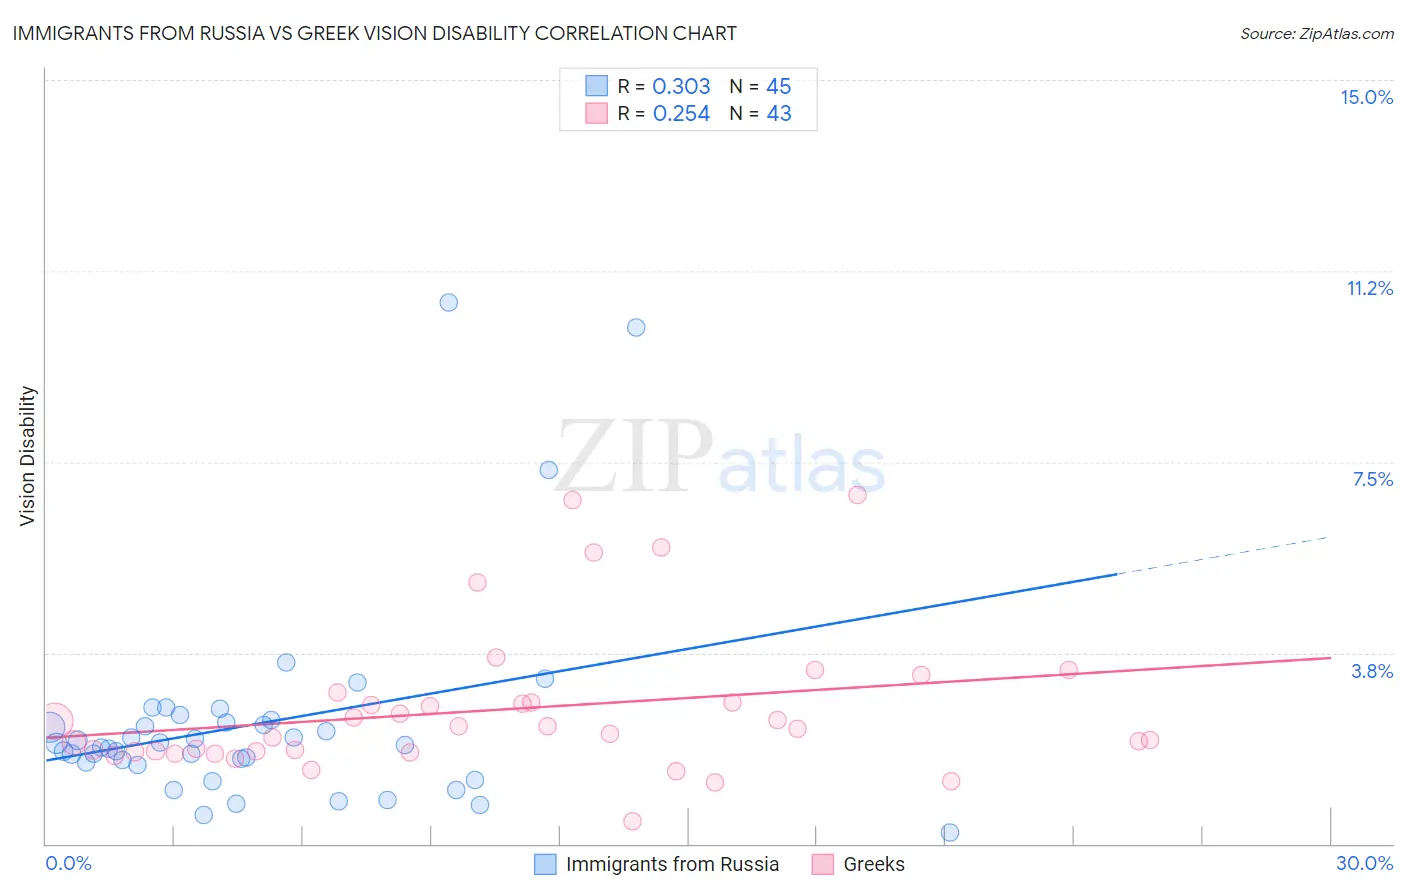
Immigrants from Russia vs Greek Vision Disability Correlation Chart
The statistical analysis conducted on geographies consisting of 347,675,214 people shows a mild positive correlation between the proportion of Immigrants from Russia and percentage of population with vision disability in the United States with a correlation coefficient (R) of 0.303 and weighted average of 2.0%. Similarly, the statistical analysis conducted on geographies consisting of 482,063,335 people shows a weak positive correlation between the proportion of Greeks and percentage of population with vision disability in the United States with a correlation coefficient (R) of 0.254 and weighted average of 2.1%, a difference of 2.9%.
Vision Disability Correlation Summary
| Measurement | Immigrants from Russia | Greek |
| Minimum | 0.22% | 0.45% |
| Maximum | 10.6% | 6.8% |
| Range | 10.4% | 6.4% |
| Mean | 2.4% | 2.6% |
| Median | 1.9% | 2.3% |
| Interquartile 25% (IQ1) | 1.6% | 1.8% |
| Interquartile 75% (IQ3) | 2.4% | 2.8% |
| Interquartile Range (IQR) | 0.85% | 0.98% |
| Standard Deviation (Sample) | 2.1% | 1.4% |
| Standard Deviation (Population) | 2.0% | 1.4% |
Similar Demographics by Vision Disability
Demographics Similar to Immigrants from Russia by Vision Disability
In terms of vision disability, the demographic groups most similar to Immigrants from Russia are Immigrants from Belgium (2.0%, a difference of 0.020%), Immigrants from Romania (2.0%, a difference of 0.030%), Argentinean (2.0%, a difference of 0.060%), Armenian (2.0%, a difference of 0.11%), and Immigrants from Saudi Arabia (2.0%, a difference of 0.21%).
| Demographics | Rating | Rank | Vision Disability |
| Laotians | 99.3 /100 | #55 | Exceptional 2.0% |
| Jordanians | 99.2 /100 | #56 | Exceptional 2.0% |
| Somalis | 99.2 /100 | #57 | Exceptional 2.0% |
| Immigrants | Saudi Arabia | 99.2 /100 | #58 | Exceptional 2.0% |
| Argentineans | 99.1 /100 | #59 | Exceptional 2.0% |
| Immigrants | Romania | 99.1 /100 | #60 | Exceptional 2.0% |
| Immigrants | Belgium | 99.1 /100 | #61 | Exceptional 2.0% |
| Immigrants | Russia | 99.1 /100 | #62 | Exceptional 2.0% |
| Armenians | 99.0 /100 | #63 | Exceptional 2.0% |
| Immigrants | Greece | 99.0 /100 | #64 | Exceptional 2.0% |
| Maltese | 98.9 /100 | #65 | Exceptional 2.0% |
| Immigrants | Argentina | 98.9 /100 | #66 | Exceptional 2.0% |
| Immigrants | Northern Africa | 98.8 /100 | #67 | Exceptional 2.0% |
| Immigrants | Czechoslovakia | 98.7 /100 | #68 | Exceptional 2.0% |
| Russians | 98.6 /100 | #69 | Exceptional 2.0% |
Demographics Similar to Greeks by Vision Disability
In terms of vision disability, the demographic groups most similar to Greeks are Estonian (2.1%, a difference of 0.040%), Albanian (2.1%, a difference of 0.080%), Immigrants from South Africa (2.1%, a difference of 0.11%), Sri Lankan (2.1%, a difference of 0.11%), and Immigrants from Afghanistan (2.1%, a difference of 0.16%).
| Demographics | Rating | Rank | Vision Disability |
| Immigrants | Europe | 96.1 /100 | #93 | Exceptional 2.1% |
| Immigrants | Croatia | 96.0 /100 | #94 | Exceptional 2.1% |
| Australians | 95.9 /100 | #95 | Exceptional 2.1% |
| Romanians | 95.7 /100 | #96 | Exceptional 2.1% |
| Immigrants | Afghanistan | 95.6 /100 | #97 | Exceptional 2.1% |
| Immigrants | South Africa | 95.4 /100 | #98 | Exceptional 2.1% |
| Estonians | 95.3 /100 | #99 | Exceptional 2.1% |
| Greeks | 95.1 /100 | #100 | Exceptional 2.1% |
| Albanians | 94.9 /100 | #101 | Exceptional 2.1% |
| Sri Lankans | 94.8 /100 | #102 | Exceptional 2.1% |
| Immigrants | Austria | 94.4 /100 | #103 | Exceptional 2.1% |
| Immigrants | Italy | 94.4 /100 | #104 | Exceptional 2.1% |
| Carpatho Rusyns | 94.3 /100 | #105 | Exceptional 2.1% |
| Swedes | 94.2 /100 | #106 | Exceptional 2.1% |
| Danes | 94.2 /100 | #107 | Exceptional 2.1% |