Immigrants from Portugal vs Somali Self-Care Disability
COMPARE
Immigrants from Portugal
Somali
Self-Care Disability
Self-Care Disability Comparison
Immigrants from Portugal
Somalis
2.8%
SELF-CARE DISABILITY
0.0/ 100
METRIC RATING
296th/ 347
METRIC RANK
2.5%
SELF-CARE DISABILITY
63.7/ 100
METRIC RATING
162nd/ 347
METRIC RANK
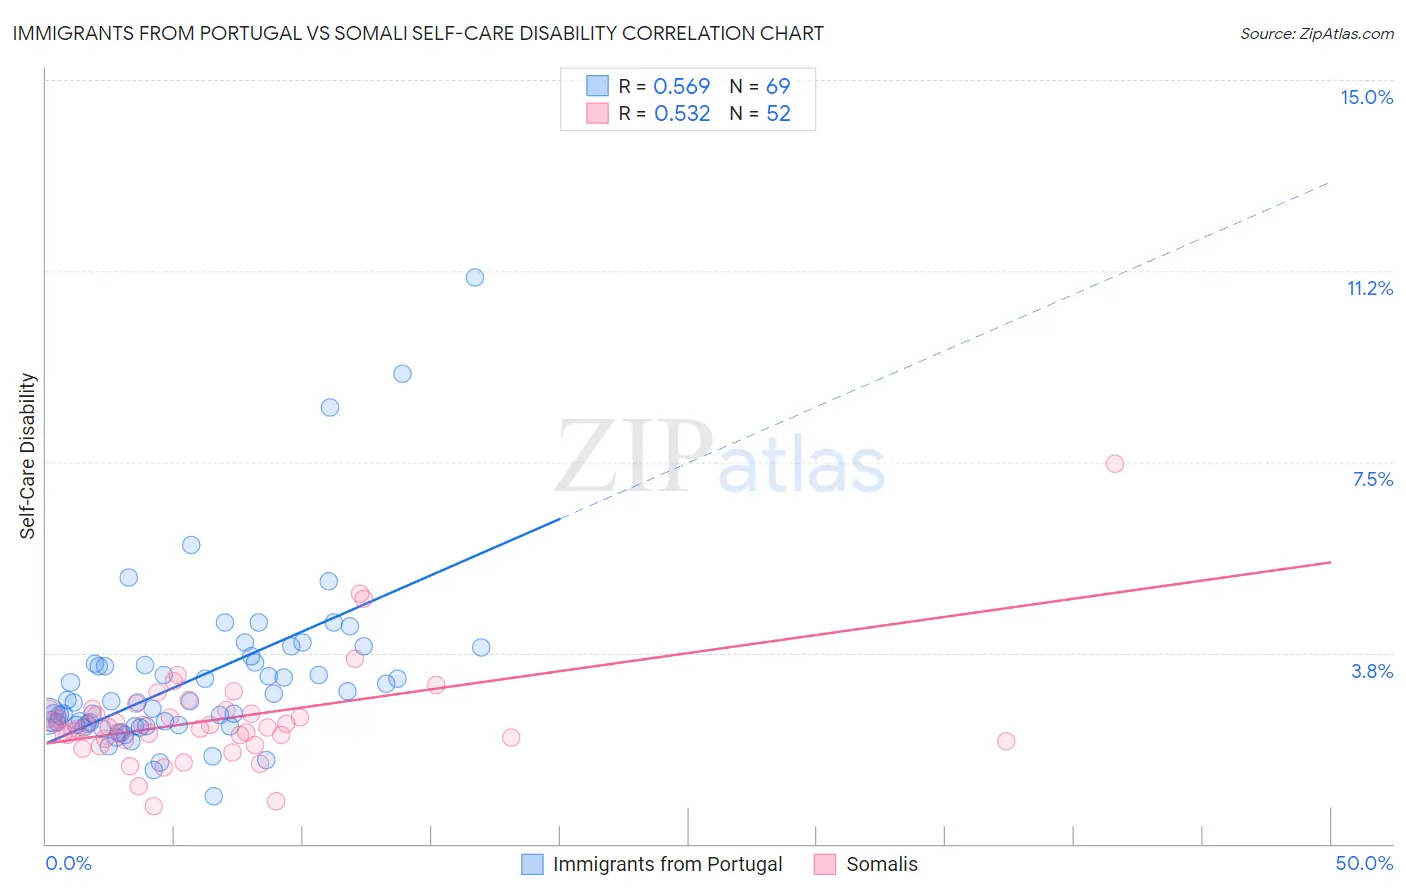
Immigrants from Portugal vs Somali Self-Care Disability Correlation Chart
The statistical analysis conducted on geographies consisting of 174,707,428 people shows a substantial positive correlation between the proportion of Immigrants from Portugal and percentage of population with self-care disability in the United States with a correlation coefficient (R) of 0.569 and weighted average of 2.8%. Similarly, the statistical analysis conducted on geographies consisting of 99,258,512 people shows a substantial positive correlation between the proportion of Somalis and percentage of population with self-care disability in the United States with a correlation coefficient (R) of 0.532 and weighted average of 2.5%, a difference of 12.6%.
Self-Care Disability Correlation Summary
| Measurement | Immigrants from Portugal | Somali |
| Minimum | 0.93% | 0.74% |
| Maximum | 11.1% | 7.5% |
| Range | 10.2% | 6.7% |
| Mean | 3.2% | 2.4% |
| Median | 2.8% | 2.3% |
| Interquartile 25% (IQ1) | 2.3% | 2.0% |
| Interquartile 75% (IQ3) | 3.6% | 2.6% |
| Interquartile Range (IQR) | 1.2% | 0.54% |
| Standard Deviation (Sample) | 1.7% | 1.0% |
| Standard Deviation (Population) | 1.7% | 1.0% |
Similar Demographics by Self-Care Disability
Demographics Similar to Immigrants from Portugal by Self-Care Disability
In terms of self-care disability, the demographic groups most similar to Immigrants from Portugal are West Indian (2.8%, a difference of 0.090%), American (2.8%, a difference of 0.20%), Immigrants from Guyana (2.8%, a difference of 0.29%), Barbadian (2.7%, a difference of 0.43%), and Belizean (2.7%, a difference of 0.57%).
| Demographics | Rating | Rank | Self-Care Disability |
| Africans | 0.0 /100 | #289 | Tragic 2.7% |
| Cubans | 0.0 /100 | #290 | Tragic 2.7% |
| Guyanese | 0.0 /100 | #291 | Tragic 2.7% |
| Central American Indians | 0.0 /100 | #292 | Tragic 2.7% |
| Belizeans | 0.0 /100 | #293 | Tragic 2.7% |
| Blackfeet | 0.0 /100 | #294 | Tragic 2.7% |
| Barbadians | 0.0 /100 | #295 | Tragic 2.7% |
| Immigrants | Portugal | 0.0 /100 | #296 | Tragic 2.8% |
| West Indians | 0.0 /100 | #297 | Tragic 2.8% |
| Americans | 0.0 /100 | #298 | Tragic 2.8% |
| Immigrants | Guyana | 0.0 /100 | #299 | Tragic 2.8% |
| Immigrants | Fiji | 0.0 /100 | #300 | Tragic 2.8% |
| Pima | 0.0 /100 | #301 | Tragic 2.8% |
| Immigrants | St. Vincent and the Grenadines | 0.0 /100 | #302 | Tragic 2.8% |
| Immigrants | Belize | 0.0 /100 | #303 | Tragic 2.8% |
Demographics Similar to Somalis by Self-Care Disability
In terms of self-care disability, the demographic groups most similar to Somalis are German Russian (2.5%, a difference of 0.050%), Lebanese (2.4%, a difference of 0.14%), Finnish (2.4%, a difference of 0.17%), Immigrants from Vietnam (2.5%, a difference of 0.23%), and Syrian (2.5%, a difference of 0.24%).
| Demographics | Rating | Rank | Self-Care Disability |
| Pakistanis | 71.4 /100 | #155 | Good 2.4% |
| Nigerians | 70.6 /100 | #156 | Good 2.4% |
| Immigrants | Europe | 69.6 /100 | #157 | Good 2.4% |
| Immigrants | Western Europe | 68.6 /100 | #158 | Good 2.4% |
| Immigrants | Italy | 68.5 /100 | #159 | Good 2.4% |
| Finns | 67.0 /100 | #160 | Good 2.4% |
| Lebanese | 66.5 /100 | #161 | Good 2.4% |
| Somalis | 63.7 /100 | #162 | Good 2.5% |
| German Russians | 62.7 /100 | #163 | Good 2.5% |
| Immigrants | Vietnam | 59.3 /100 | #164 | Average 2.5% |
| Syrians | 59.0 /100 | #165 | Average 2.5% |
| Canadians | 58.8 /100 | #166 | Average 2.5% |
| Immigrants | Greece | 57.3 /100 | #167 | Average 2.5% |
| Ute | 57.1 /100 | #168 | Average 2.5% |
| Immigrants | Somalia | 55.9 /100 | #169 | Average 2.5% |