Immigrants from Portugal vs Immigrants from Dominica Self-Care Disability
COMPARE
Immigrants from Portugal
Immigrants from Dominica
Self-Care Disability
Self-Care Disability Comparison
Immigrants from Portugal
Immigrants from Dominica
2.8%
SELF-CARE DISABILITY
0.0/ 100
METRIC RATING
296th/ 347
METRIC RANK
2.8%
SELF-CARE DISABILITY
0.0/ 100
METRIC RATING
317th/ 347
METRIC RANK
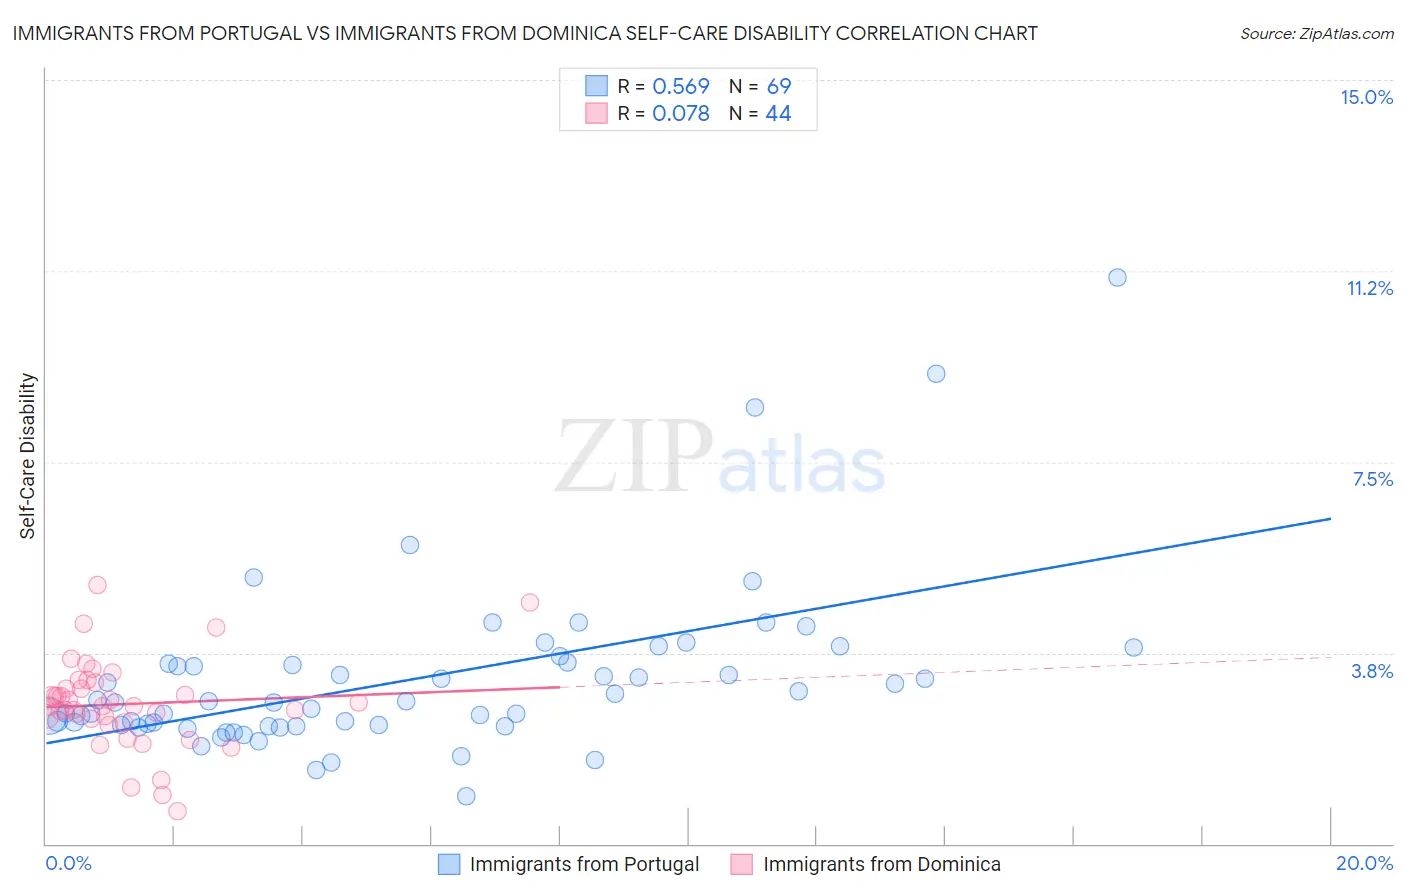
Immigrants from Portugal vs Immigrants from Dominica Self-Care Disability Correlation Chart
The statistical analysis conducted on geographies consisting of 174,707,428 people shows a substantial positive correlation between the proportion of Immigrants from Portugal and percentage of population with self-care disability in the United States with a correlation coefficient (R) of 0.569 and weighted average of 2.8%. Similarly, the statistical analysis conducted on geographies consisting of 83,776,311 people shows a slight positive correlation between the proportion of Immigrants from Dominica and percentage of population with self-care disability in the United States with a correlation coefficient (R) of 0.078 and weighted average of 2.8%, a difference of 3.3%.
Self-Care Disability Correlation Summary
| Measurement | Immigrants from Portugal | Immigrants from Dominica |
| Minimum | 0.93% | 0.64% |
| Maximum | 11.1% | 5.1% |
| Range | 10.2% | 4.4% |
| Mean | 3.2% | 2.7% |
| Median | 2.8% | 2.7% |
| Interquartile 25% (IQ1) | 2.3% | 2.4% |
| Interquartile 75% (IQ3) | 3.6% | 3.1% |
| Interquartile Range (IQR) | 1.2% | 0.69% |
| Standard Deviation (Sample) | 1.7% | 0.88% |
| Standard Deviation (Population) | 1.7% | 0.87% |
Similar Demographics by Self-Care Disability
Demographics Similar to Immigrants from Portugal by Self-Care Disability
In terms of self-care disability, the demographic groups most similar to Immigrants from Portugal are West Indian (2.8%, a difference of 0.090%), American (2.8%, a difference of 0.20%), Immigrants from Guyana (2.8%, a difference of 0.29%), Barbadian (2.7%, a difference of 0.43%), and Belizean (2.7%, a difference of 0.57%).
| Demographics | Rating | Rank | Self-Care Disability |
| Africans | 0.0 /100 | #289 | Tragic 2.7% |
| Cubans | 0.0 /100 | #290 | Tragic 2.7% |
| Guyanese | 0.0 /100 | #291 | Tragic 2.7% |
| Central American Indians | 0.0 /100 | #292 | Tragic 2.7% |
| Belizeans | 0.0 /100 | #293 | Tragic 2.7% |
| Blackfeet | 0.0 /100 | #294 | Tragic 2.7% |
| Barbadians | 0.0 /100 | #295 | Tragic 2.7% |
| Immigrants | Portugal | 0.0 /100 | #296 | Tragic 2.8% |
| West Indians | 0.0 /100 | #297 | Tragic 2.8% |
| Americans | 0.0 /100 | #298 | Tragic 2.8% |
| Immigrants | Guyana | 0.0 /100 | #299 | Tragic 2.8% |
| Immigrants | Fiji | 0.0 /100 | #300 | Tragic 2.8% |
| Pima | 0.0 /100 | #301 | Tragic 2.8% |
| Immigrants | St. Vincent and the Grenadines | 0.0 /100 | #302 | Tragic 2.8% |
| Immigrants | Belize | 0.0 /100 | #303 | Tragic 2.8% |
Demographics Similar to Immigrants from Dominica by Self-Care Disability
In terms of self-care disability, the demographic groups most similar to Immigrants from Dominica are Assyrian/Chaldean/Syriac (2.8%, a difference of 0.010%), Menominee (2.8%, a difference of 0.13%), Spanish American Indian (2.9%, a difference of 0.17%), Immigrants from Cuba (2.8%, a difference of 0.23%), and Chickasaw (2.9%, a difference of 0.38%).
| Demographics | Rating | Rank | Self-Care Disability |
| British West Indians | 0.0 /100 | #310 | Tragic 2.8% |
| Puget Sound Salish | 0.0 /100 | #311 | Tragic 2.8% |
| Immigrants | Caribbean | 0.0 /100 | #312 | Tragic 2.8% |
| Spanish Americans | 0.0 /100 | #313 | Tragic 2.8% |
| Creek | 0.0 /100 | #314 | Tragic 2.8% |
| Immigrants | Cuba | 0.0 /100 | #315 | Tragic 2.8% |
| Menominee | 0.0 /100 | #316 | Tragic 2.8% |
| Immigrants | Dominica | 0.0 /100 | #317 | Tragic 2.8% |
| Assyrians/Chaldeans/Syriacs | 0.0 /100 | #318 | Tragic 2.8% |
| Spanish American Indians | 0.0 /100 | #319 | Tragic 2.9% |
| Chickasaw | 0.0 /100 | #320 | Tragic 2.9% |
| Navajo | 0.0 /100 | #321 | Tragic 2.9% |
| Comanche | 0.0 /100 | #322 | Tragic 2.9% |
| Seminole | 0.0 /100 | #323 | Tragic 2.9% |
| Cherokee | 0.0 /100 | #324 | Tragic 2.9% |