Immigrants from Portugal vs Kiowa Ambulatory Disability
COMPARE
Immigrants from Portugal
Kiowa
Ambulatory Disability
Ambulatory Disability Comparison
Immigrants from Portugal
Kiowa
6.5%
AMBULATORY DISABILITY
1.4/ 100
METRIC RATING
248th/ 347
METRIC RANK
8.6%
AMBULATORY DISABILITY
0.0/ 100
METRIC RATING
342nd/ 347
METRIC RANK
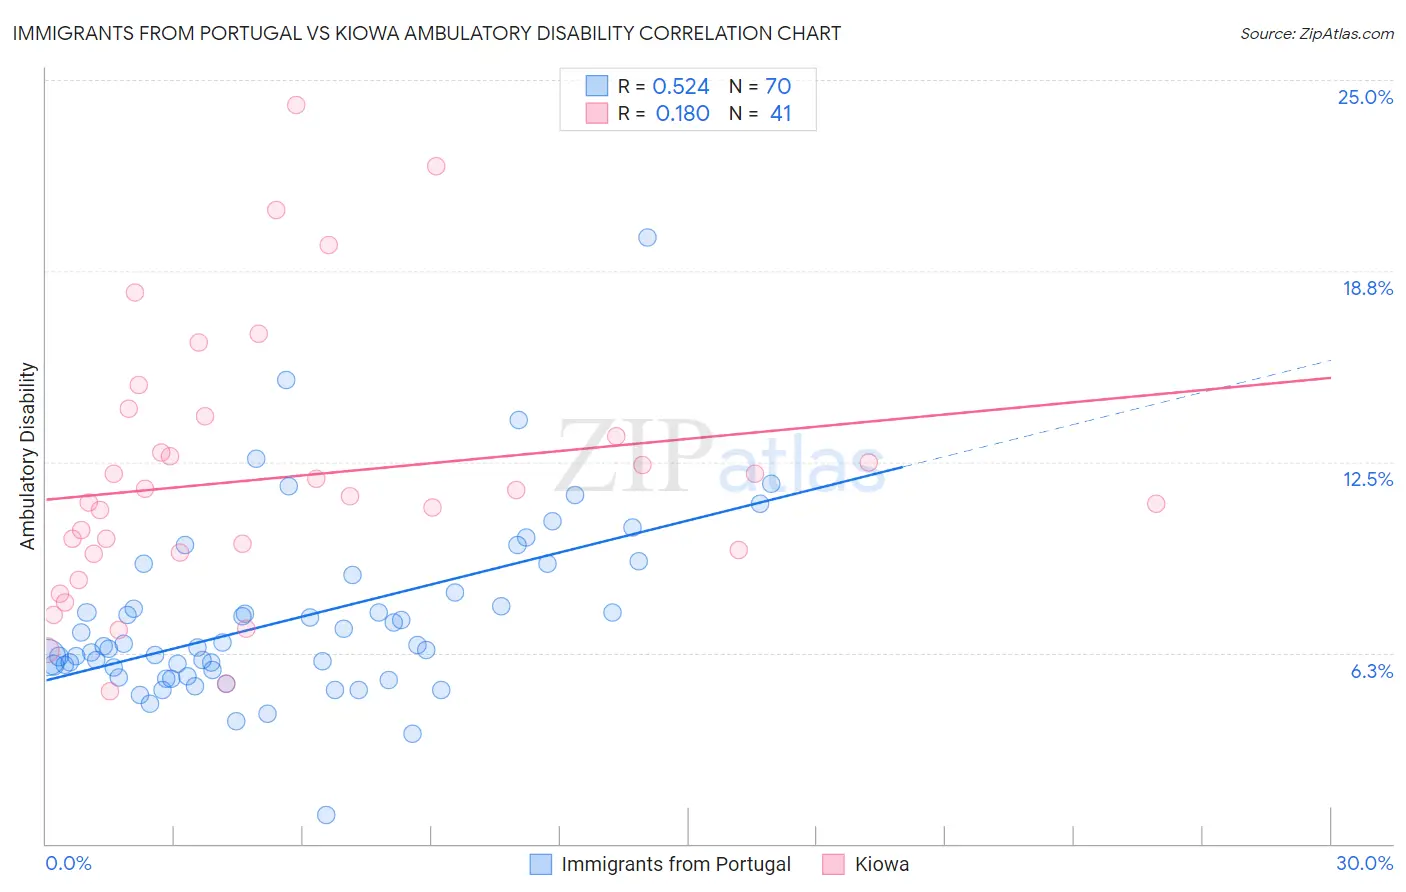
Immigrants from Portugal vs Kiowa Ambulatory Disability Correlation Chart
The statistical analysis conducted on geographies consisting of 174,768,730 people shows a substantial positive correlation between the proportion of Immigrants from Portugal and percentage of population with ambulatory disability in the United States with a correlation coefficient (R) of 0.524 and weighted average of 6.5%. Similarly, the statistical analysis conducted on geographies consisting of 56,098,289 people shows a poor positive correlation between the proportion of Kiowa and percentage of population with ambulatory disability in the United States with a correlation coefficient (R) of 0.180 and weighted average of 8.6%, a difference of 33.2%.
Ambulatory Disability Correlation Summary
| Measurement | Immigrants from Portugal | Kiowa |
| Minimum | 0.93% | 5.0% |
| Maximum | 19.8% | 24.2% |
| Range | 18.9% | 19.2% |
| Mean | 7.3% | 12.0% |
| Median | 6.5% | 11.4% |
| Interquartile 25% (IQ1) | 5.7% | 9.5% |
| Interquartile 75% (IQ3) | 8.2% | 13.7% |
| Interquartile Range (IQR) | 2.5% | 4.2% |
| Standard Deviation (Sample) | 2.9% | 4.4% |
| Standard Deviation (Population) | 2.9% | 4.3% |
Similar Demographics by Ambulatory Disability
Demographics Similar to Immigrants from Portugal by Ambulatory Disability
In terms of ambulatory disability, the demographic groups most similar to Immigrants from Portugal are Immigrants from Cuba (6.5%, a difference of 0.020%), Armenian (6.5%, a difference of 0.070%), Tlingit-Haida (6.5%, a difference of 0.090%), German (6.5%, a difference of 0.12%), and Immigrants from Panama (6.5%, a difference of 0.12%).
| Demographics | Rating | Rank | Ambulatory Disability |
| Immigrants | Haiti | 1.6 /100 | #241 | Tragic 6.5% |
| Spaniards | 1.6 /100 | #242 | Tragic 6.5% |
| Germans | 1.5 /100 | #243 | Tragic 6.5% |
| Immigrants | Panama | 1.5 /100 | #244 | Tragic 6.5% |
| Tlingit-Haida | 1.5 /100 | #245 | Tragic 6.5% |
| Armenians | 1.5 /100 | #246 | Tragic 6.5% |
| Immigrants | Cuba | 1.4 /100 | #247 | Tragic 6.5% |
| Immigrants | Portugal | 1.4 /100 | #248 | Tragic 6.5% |
| Native Hawaiians | 1.1 /100 | #249 | Tragic 6.5% |
| Chinese | 1.0 /100 | #250 | Tragic 6.5% |
| Hawaiians | 0.9 /100 | #251 | Tragic 6.5% |
| Immigrants | Bahamas | 0.8 /100 | #252 | Tragic 6.5% |
| Scottish | 0.7 /100 | #253 | Tragic 6.5% |
| Belizeans | 0.7 /100 | #254 | Tragic 6.5% |
| Welsh | 0.6 /100 | #255 | Tragic 6.5% |
Demographics Similar to Kiowa by Ambulatory Disability
In terms of ambulatory disability, the demographic groups most similar to Kiowa are Tohono O'odham (8.7%, a difference of 1.5%), Creek (8.5%, a difference of 1.9%), Tsimshian (8.8%, a difference of 2.5%), Puerto Rican (8.9%, a difference of 3.1%), and Choctaw (8.3%, a difference of 3.5%).
| Demographics | Rating | Rank | Ambulatory Disability |
| Cherokee | 0.0 /100 | #333 | Tragic 7.9% |
| Yuman | 0.0 /100 | #334 | Tragic 7.9% |
| Chickasaw | 0.0 /100 | #335 | Tragic 8.0% |
| Seminole | 0.0 /100 | #336 | Tragic 8.0% |
| Dutch West Indians | 0.0 /100 | #337 | Tragic 8.2% |
| Colville | 0.0 /100 | #338 | Tragic 8.2% |
| Pima | 0.0 /100 | #339 | Tragic 8.2% |
| Choctaw | 0.0 /100 | #340 | Tragic 8.3% |
| Creek | 0.0 /100 | #341 | Tragic 8.5% |
| Kiowa | 0.0 /100 | #342 | Tragic 8.6% |
| Tohono O'odham | 0.0 /100 | #343 | Tragic 8.7% |
| Tsimshian | 0.0 /100 | #344 | Tragic 8.8% |
| Puerto Ricans | 0.0 /100 | #345 | Tragic 8.9% |
| Houma | 0.0 /100 | #346 | Tragic 9.3% |
| Lumbee | 0.0 /100 | #347 | Tragic 9.5% |