French American Indian vs Swedish Disability Age Over 75
COMPARE
French American Indian
Swedish
Disability Age Over 75
Disability Age Over 75 Comparison
French American Indians
Swedes
48.3%
DISABILITY AGE OVER 75
2.2/ 100
METRIC RATING
242nd/ 347
METRIC RANK
45.7%
DISABILITY AGE OVER 75
99.8/ 100
METRIC RATING
46th/ 347
METRIC RANK
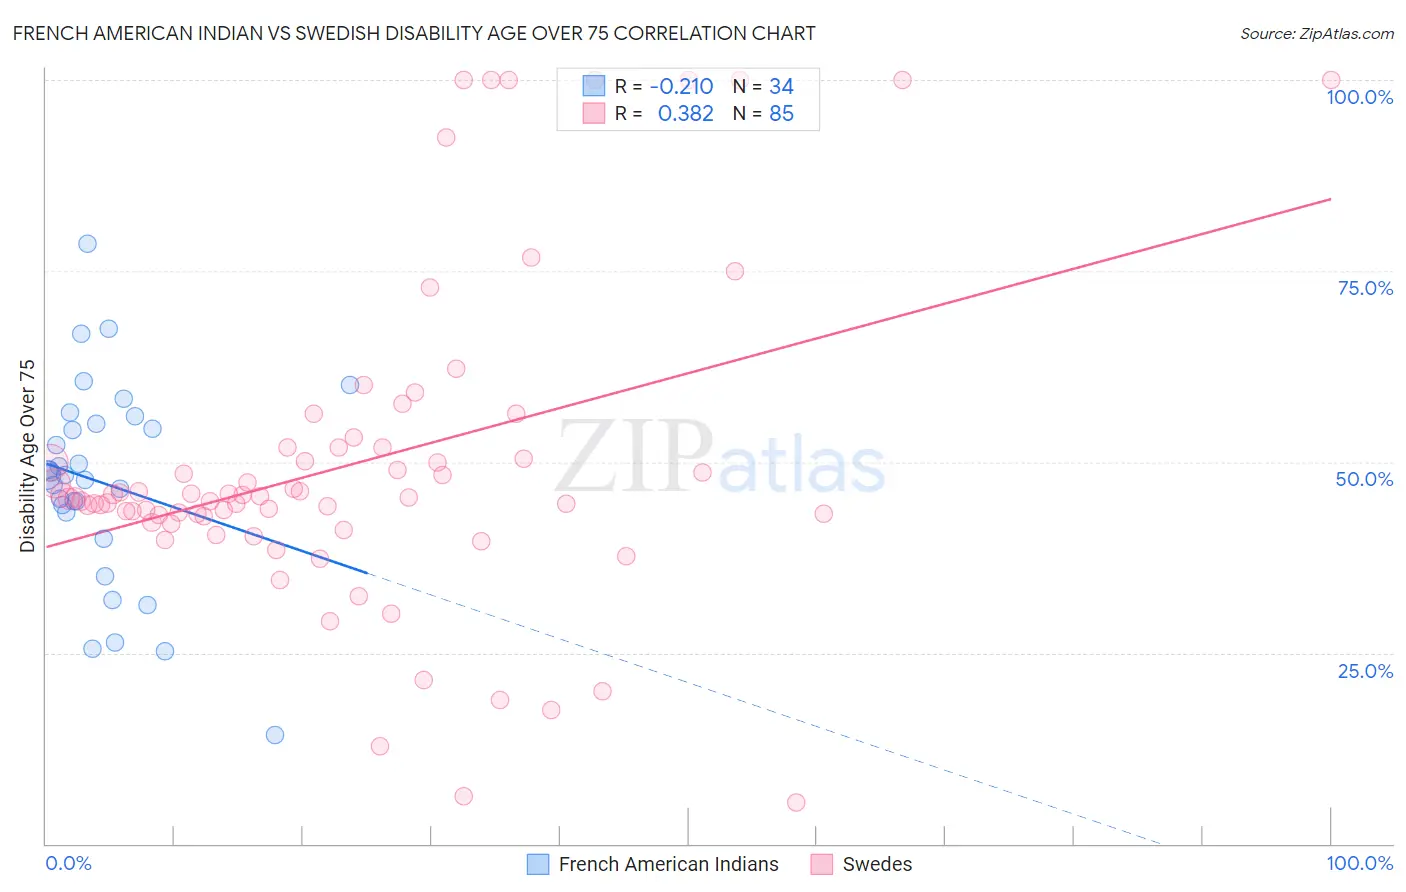
French American Indian vs Swedish Disability Age Over 75 Correlation Chart
The statistical analysis conducted on geographies consisting of 131,956,018 people shows a weak negative correlation between the proportion of French American Indians and percentage of population with a disability over the age of 75 in the United States with a correlation coefficient (R) of -0.210 and weighted average of 48.3%. Similarly, the statistical analysis conducted on geographies consisting of 537,534,553 people shows a mild positive correlation between the proportion of Swedes and percentage of population with a disability over the age of 75 in the United States with a correlation coefficient (R) of 0.382 and weighted average of 45.7%, a difference of 5.8%.
Disability Age Over 75 Correlation Summary
| Measurement | French American Indian | Swedish |
| Minimum | 14.3% | 5.4% |
| Maximum | 78.6% | 100.0% |
| Range | 64.3% | 94.6% |
| Mean | 47.3% | 49.7% |
| Median | 48.2% | 45.3% |
| Interquartile 25% (IQ1) | 43.4% | 42.5% |
| Interquartile 75% (IQ3) | 55.0% | 51.8% |
| Interquartile Range (IQR) | 11.6% | 9.4% |
| Standard Deviation (Sample) | 13.3% | 20.9% |
| Standard Deviation (Population) | 13.1% | 20.7% |
Similar Demographics by Disability Age Over 75
Demographics Similar to French American Indians by Disability Age Over 75
In terms of disability age over 75, the demographic groups most similar to French American Indians are Native Hawaiian (48.3%, a difference of 0.0%), Tongan (48.3%, a difference of 0.010%), Immigrants from Caribbean (48.4%, a difference of 0.040%), Immigrants from Thailand (48.3%, a difference of 0.12%), and Afghan (48.4%, a difference of 0.13%).
| Demographics | Rating | Rank | Disability Age Over 75 |
| Hmong | 3.8 /100 | #235 | Tragic 48.2% |
| Immigrants | Nicaragua | 3.2 /100 | #236 | Tragic 48.2% |
| Immigrants | St. Vincent and the Grenadines | 3.2 /100 | #237 | Tragic 48.2% |
| Nicaraguans | 3.0 /100 | #238 | Tragic 48.3% |
| Immigrants | Thailand | 2.8 /100 | #239 | Tragic 48.3% |
| Tongans | 2.3 /100 | #240 | Tragic 48.3% |
| Native Hawaiians | 2.2 /100 | #241 | Tragic 48.3% |
| French American Indians | 2.2 /100 | #242 | Tragic 48.3% |
| Immigrants | Caribbean | 2.1 /100 | #243 | Tragic 48.4% |
| Afghans | 1.8 /100 | #244 | Tragic 48.4% |
| Americans | 1.7 /100 | #245 | Tragic 48.4% |
| Chippewa | 1.6 /100 | #246 | Tragic 48.4% |
| Iroquois | 1.6 /100 | #247 | Tragic 48.4% |
| Sri Lankans | 1.4 /100 | #248 | Tragic 48.5% |
| Iraqis | 1.0 /100 | #249 | Tragic 48.6% |
Demographics Similar to Swedes by Disability Age Over 75
In terms of disability age over 75, the demographic groups most similar to Swedes are Immigrants from Canada (45.7%, a difference of 0.020%), Croatian (45.7%, a difference of 0.020%), Australian (45.7%, a difference of 0.030%), Turkish (45.7%, a difference of 0.030%), and Greek (45.6%, a difference of 0.070%).
| Demographics | Rating | Rank | Disability Age Over 75 |
| Estonians | 99.9 /100 | #39 | Exceptional 45.6% |
| Slovenes | 99.9 /100 | #40 | Exceptional 45.6% |
| Immigrants | Singapore | 99.8 /100 | #41 | Exceptional 45.6% |
| Greeks | 99.8 /100 | #42 | Exceptional 45.6% |
| Czechs | 99.8 /100 | #43 | Exceptional 45.7% |
| Australians | 99.8 /100 | #44 | Exceptional 45.7% |
| Turks | 99.8 /100 | #45 | Exceptional 45.7% |
| Swedes | 99.8 /100 | #46 | Exceptional 45.7% |
| Immigrants | Canada | 99.8 /100 | #47 | Exceptional 45.7% |
| Croatians | 99.8 /100 | #48 | Exceptional 45.7% |
| Immigrants | North America | 99.8 /100 | #49 | Exceptional 45.7% |
| Belgians | 99.7 /100 | #50 | Exceptional 45.8% |
| Immigrants | Korea | 99.7 /100 | #51 | Exceptional 45.8% |
| Immigrants | France | 99.7 /100 | #52 | Exceptional 45.8% |
| Immigrants | Italy | 99.7 /100 | #53 | Exceptional 45.8% |