Immigrants from Poland vs Vietnamese Disability Age Over 75

COMPARE

Immigrants from Poland
Race
Ancestry
AfghanAfricanAlaska NativeAlaskan AthabascanAlbanianAleutAlsatianAmericanApacheArabArapahoArgentineanArmenianAssyrian/Chaldean/SyriacAustralianAustrianBahamianBangladeshiBarbadianBasqueBelgianBelizeanBermudanBhutaneseBlackfeetBolivianBrazilianBritishBritish West IndianBulgarianBurmeseCajunCambodianCanadianCape VerdeanCarpatho RusynCelticCentral AmericanCentral American IndianCherokeeCheyenneChickasawChileanChineseChippewaChoctawColombianColvilleComancheCosta RicanCreeCreekCroatianCrowCubanCypriotCzechCzechoslovakianDanishDelawareDominicanDutchDutch West IndianEastern EuropeanEcuadorianEgyptianEnglishEstonianEthiopianEuropeanFijianFilipinoFinnishFrenchFrench American IndianFrench CanadianGermanGerman RussianGhanaianGreekGuamanian/ChamorroGuatemalanGuyaneseHaitianHmongHonduranHopiHoumaHungarianIcelanderIndian (Asian)IndonesianInupiatIranianIraqiIrishIroquoisIsraeliItalianJamaicanJapaneseJordanianKenyanKiowaKoreanLaotianLatvianLebaneseLiberianLithuanianLumbeeLuxembourgerMacedonianMalaysianMalteseMarshalleseMenomineeMexicanMexican American IndianMongolianMoroccanNative HawaiianNavajoNepaleseNew ZealanderNicaraguanNigerianNorthern EuropeanNorwegianOkinawanOsageOttawaPaiutePakistaniPalestinianPanamanianParaguayanPennsylvania GermanPeruvianPimaPolishPortuguesePotawatomiPuebloPuerto RicanPuget Sound SalishRomanianRussianSalvadoranSamoanScandinavianScotch-IrishScottishSeminoleSenegaleseSerbianShoshoneSierra LeoneanSiouxSlavicSlovakSloveneSomaliSouth AfricanSouth AmericanSouth American IndianSoviet UnionSpaniardSpanishSpanish AmericanSpanish American IndianSri LankanSubsaharan AfricanSudaneseSwedishSwissSyrianTaiwaneseThaiTlingit-HaidaTohono O'OdhamTonganTrinidadian and TobagonianTsimshianTurkishU.S. Virgin IslanderUgandanUkrainianUruguayanUteVenezuelanWelshWest IndianYakamaYaquiYugoslavianYumanYup'ikZimbabwean
Immigration
NonimmigrantsImmigrantsAfghanistanAfricaAlbaniaArgentinaArmeniaAsiaAustraliaAustriaBahamasBangladeshBarbadosBelarusBelgiumBelizeBoliviaBosnia and HerzegovinaBrazilBulgariaBurma/MyanmarCabo VerdeCambodiaCameroonCanadaCaribbeanCentral AmericaChileChinaColombiaCongoCosta RicaCroatiaCubaCzechoslovakiaDenmarkDominicaDominican RepublicEastern AfricaEastern AsiaEastern EuropeEcuadorEgyptEl SalvadorEnglandEritreaEthiopiaEuropeFijiFranceGermanyGhanaGreeceGrenadaGuatemalaGuyanaHaitiHondurasHong KongHungaryIndiaIndonesiaIranIraqIrelandIsraelItalyJamaicaJapanJordanKazakhstanKenyaKoreaKuwaitLaosLatin AmericaLatviaLebanonLiberiaLithuaniaMalaysiaMexicoMicronesiaMiddle AfricaMoldovaMoroccoNepalNetherlandsNicaraguaNigeriaNorth AmericaNorth MacedoniaNorthern AfricaNorthern EuropeNorwayOceaniaPakistanPanamaPeruPhilippinesPolandPortugalRomaniaRussiaSaudi ArabiaScotlandSenegalSerbiaSierra LeoneSingaporeSomaliaSouth AfricaSouth AmericaSouth Central AsiaSouth Eastern AsiaSouthern EuropeSpainSri LankaSt. Vincent and the GrenadinesSudanSwedenSwitzerlandSyriaTaiwanThailandTrinidad and TobagoTurkeyUgandaUkraineUruguayUzbekistanVenezuelaVietnamWest IndiesWestern AfricaWestern AsiaWestern EuropeYemenZaireZimbabweAzores
Vietnamese
Race
Ancestry
AfghanAfricanAlaska NativeAlaskan AthabascanAlbanianAleutAlsatianAmericanApacheArabArapahoArgentineanArmenianAssyrian/Chaldean/SyriacAustralianAustrianBahamianBangladeshiBarbadianBasqueBelgianBelizeanBermudanBhutaneseBlackfeetBolivianBrazilianBritishBritish West IndianBulgarianBurmeseCajunCambodianCanadianCape VerdeanCarpatho RusynCelticCentral AmericanCentral American IndianCherokeeCheyenneChickasawChileanChineseChippewaChoctawColombianColvilleComancheCosta RicanCreeCreekCroatianCrowCubanCypriotCzechCzechoslovakianDanishDelawareDominicanDutchDutch West IndianEastern EuropeanEcuadorianEgyptianEnglishEstonianEthiopianEuropeanFijianFilipinoFinnishFrenchFrench American IndianFrench CanadianGermanGerman RussianGhanaianGreekGuamanian/ChamorroGuatemalanGuyaneseHaitianHmongHonduranHopiHoumaHungarianIcelanderIndian (Asian)IndonesianInupiatIranianIraqiIrishIroquoisIsraeliItalianJamaicanJapaneseJordanianKenyanKiowaKoreanLaotianLatvianLebaneseLiberianLithuanianLumbeeLuxembourgerMacedonianMalaysianMalteseMarshalleseMenomineeMexicanMexican American IndianMongolianMoroccanNative HawaiianNavajoNepaleseNew ZealanderNicaraguanNigerianNorthern EuropeanNorwegianOkinawanOsageOttawaPaiutePakistaniPalestinianPanamanianParaguayanPennsylvania GermanPeruvianPimaPolishPortuguesePotawatomiPuebloPuerto RicanPuget Sound SalishRomanianRussianSalvadoranSamoanScandinavianScotch-IrishScottishSeminoleSenegaleseSerbianShoshoneSierra LeoneanSiouxSlavicSlovakSloveneSomaliSouth AfricanSouth AmericanSouth American IndianSoviet UnionSpaniardSpanishSpanish AmericanSpanish American IndianSri LankanSubsaharan AfricanSudaneseSwedishSwissSyrianTaiwaneseThaiTlingit-HaidaTohono O'OdhamTonganTrinidadian and TobagonianTsimshianTurkishU.S. Virgin IslanderUgandanUkrainianUruguayanUteVenezuelanVietnameseWelshWest IndianYakamaYaquiYugoslavianYumanYup'ikZimbabwean
Immigration
NonimmigrantsImmigrantsAfghanistanAfricaAlbaniaArgentinaArmeniaAsiaAustraliaAustriaBahamasBangladeshBarbadosBelarusBelgiumBelizeBoliviaBosnia and HerzegovinaBrazilBulgariaBurma/MyanmarCabo VerdeCambodiaCameroonCanadaCaribbeanCentral AmericaChileChinaColombiaCongoCosta RicaCroatiaCubaCzechoslovakiaDenmarkDominicaDominican RepublicEastern AfricaEastern AsiaEastern EuropeEcuadorEgyptEl SalvadorEnglandEritreaEthiopiaEuropeFijiFranceGermanyGhanaGreeceGrenadaGuatemalaGuyanaHaitiHondurasHong KongHungaryIndiaIndonesiaIranIraqIrelandIsraelItalyJamaicaJapanJordanKazakhstanKenyaKoreaKuwaitLaosLatin AmericaLatviaLebanonLiberiaLithuaniaMalaysiaMexicoMicronesiaMiddle AfricaMoldovaMoroccoNepalNetherlandsNicaraguaNigeriaNorth AmericaNorth MacedoniaNorthern AfricaNorthern EuropeNorwayOceaniaPakistanPanamaPeruPhilippinesPortugalRomaniaRussiaSaudi ArabiaScotlandSenegalSerbiaSierra LeoneSingaporeSomaliaSouth AfricaSouth AmericaSouth Central AsiaSouth Eastern AsiaSouthern EuropeSpainSri LankaSt. Vincent and the GrenadinesSudanSwedenSwitzerlandSyriaTaiwanThailandTrinidad and TobagoTurkeyUgandaUkraineUruguayUzbekistanVenezuelaVietnamWest IndiesWestern AfricaWestern AsiaWestern EuropeYemenZaireZimbabweAzores
Disability Age Over 75
Income
Poverty
Unemployment
Labor Participation
Family Structure
Vehicle Availability
Education Level
Disability

Disability Age Over 75 Comparison

Immigrants from Poland

Vietnamese

Exceptional
Poor
45.4%
DISABILITY AGE OVER 75
99.9/ 100
METRIC RATING
27th/ 347
METRIC RANK
47.9%
DISABILITY AGE OVER 75
11.9/ 100
METRIC RATING
210th/ 347
METRIC RANK

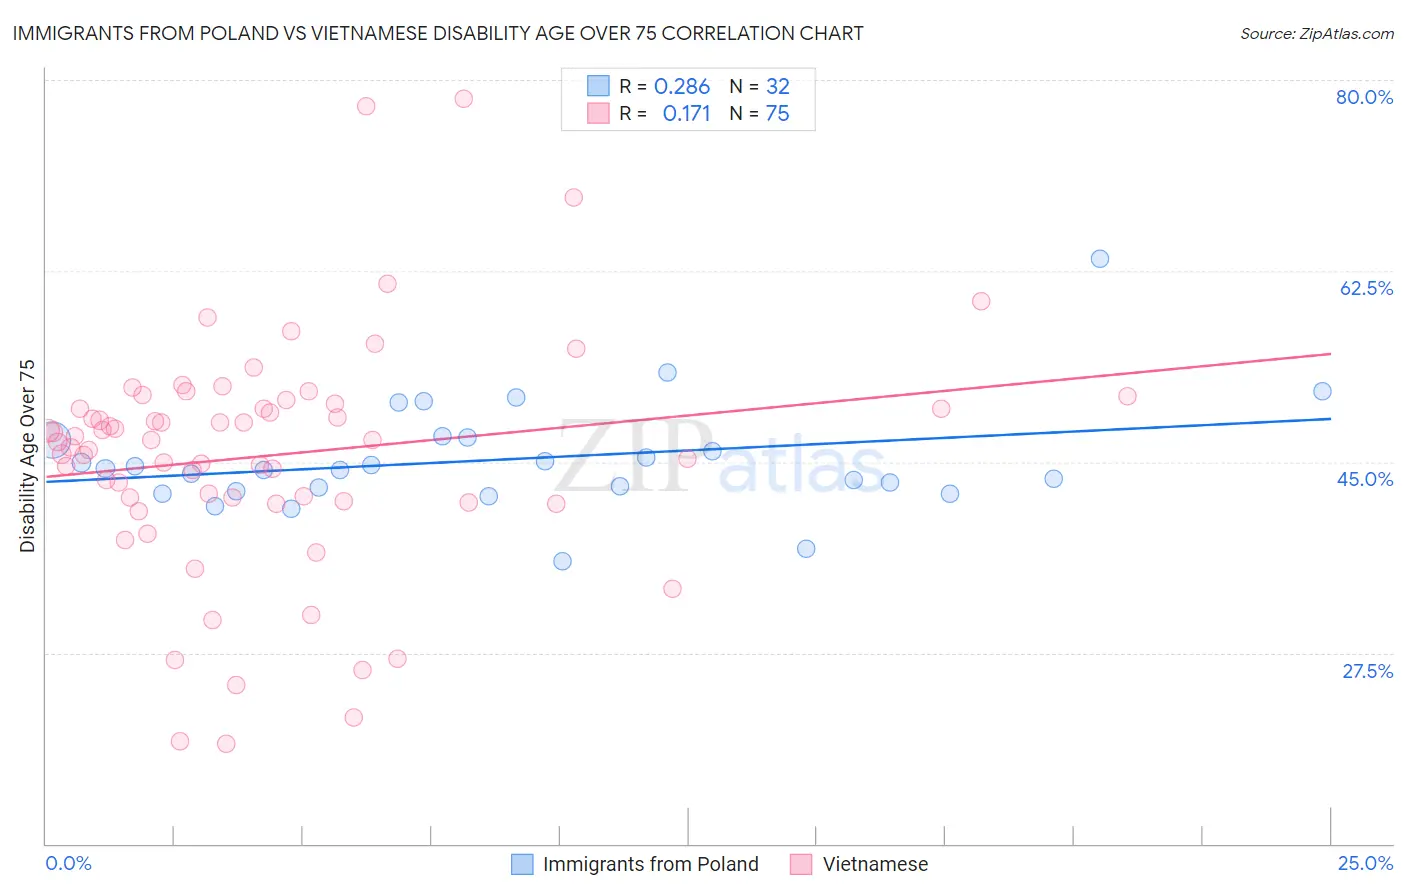
Immigrants from Poland vs Vietnamese Disability Age Over 75 Correlation Chart

The statistical analysis conducted on geographies consisting of 304,637,447 people shows a weak positive correlation between the proportion of Immigrants from Poland and percentage of population with a disability over the age of 75 in the United States with a correlation coefficient (R) of 0.286 and weighted average of 45.4%. Similarly, the statistical analysis conducted on geographies consisting of 170,542,891 people shows a poor positive correlation between the proportion of Vietnamese and percentage of population with a disability over the age of 75 in the United States with a correlation coefficient (R) of 0.171 and weighted average of 47.9%, a difference of 5.5%.
Immigrants from Poland vs Vietnamese Disability Age Over 75

Disability Age Over 75 Correlation Summary

MeasurementImmigrants from PolandVietnamese
Minimum35.9%19.1%
Maximum63.6%78.3%
Range27.7%59.2%
Mean45.2%45.6%
Median44.4%47.0%
Interquartile 25% (IQ1)42.5%41.4%
Interquartile 75% (IQ3)47.1%50.3%
Interquartile Range (IQR)4.6%8.9%
Standard Deviation (Sample)5.1%10.8%
Standard Deviation (Population)5.0%10.8%

Similar Demographics by Disability Age Over 75

Demographics Similar to Immigrants from Poland by Disability Age Over 75

In terms of disability age over 75, the demographic groups most similar to Immigrants from Poland are Macedonian (45.4%, a difference of 0.010%), Thai (45.4%, a difference of 0.020%), Immigrants from Bolivia (45.4%, a difference of 0.050%), Filipino (45.4%, a difference of 0.060%), and Polish (45.3%, a difference of 0.090%).
DemographicsRating | RankDisability Age Over 75
Immigrants | Serbia
100.0
/100
|
#20
Exceptional
45.3%
Immigrants | Belgium
100.0
/100
|
#21
Exceptional
45.3%
Immigrants | South Africa
100.0
/100
|
#22
Exceptional
45.3%
Immigrants | Switzerland
99.9
/100
|
#23
Exceptional
45.3%
Poles
99.9
/100
|
#24
Exceptional
45.3%
Immigrants | Bolivia
99.9
/100
|
#25
Exceptional
45.4%
Macedonians
99.9
/100
|
#26
Exceptional
45.4%
Immigrants | Poland
99.9
/100
|
#27
Exceptional
45.4%
Thais
99.9
/100
|
#28
Exceptional
45.4%
Filipinos
99.9
/100
|
#29
Exceptional
45.4%
Immigrants | Denmark
99.9
/100
|
#30
Exceptional
45.4%
Immigrants | Bulgaria
99.9
/100
|
#31
Exceptional
45.5%
Immigrants | Australia
99.9
/100
|
#32
Exceptional
45.5%
Immigrants | Croatia
99.9
/100
|
#33
Exceptional
45.5%
Russians
99.9
/100
|
#34
Exceptional
45.5%

Demographics Similar to Vietnamese by Disability Age Over 75

In terms of disability age over 75, the demographic groups most similar to Vietnamese are Panamanian (47.9%, a difference of 0.010%), Immigrants from Burma/Myanmar (47.9%, a difference of 0.010%), Laotian (47.9%, a difference of 0.020%), Immigrants from Barbados (47.9%, a difference of 0.070%), and Senegalese (47.9%, a difference of 0.070%).
DemographicsRating | RankDisability Age Over 75
Trinidadians and Tobagonians
20.0
/100
|
#203
Fair
47.7%
Nigerians
19.2
/100
|
#204
Poor
47.7%
Immigrants | Ghana
19.1
/100
|
#205
Poor
47.7%
Jamaicans
19.0
/100
|
#206
Poor
47.7%
Immigrants | Syria
17.4
/100
|
#207
Poor
47.8%
Immigrants | Senegal
16.9
/100
|
#208
Poor
47.8%
Immigrants | Indonesia
14.2
/100
|
#209
Poor
47.8%
Vietnamese
11.9
/100
|
#210
Poor
47.9%
Panamanians
11.8
/100
|
#211
Poor
47.9%
Immigrants | Burma/Myanmar
11.7
/100
|
#212
Poor
47.9%
Laotians
11.5
/100
|
#213
Poor
47.9%
Immigrants | Barbados
10.7
/100
|
#214
Poor
47.9%
Senegalese
10.7
/100
|
#215
Poor
47.9%
Immigrants | Panama
10.2
/100
|
#216
Poor
47.9%
Immigrants | Grenada
9.4
/100
|
#217
Tragic
47.9%