Immigrants from Peru vs Tohono O'odham Disability Age Over 75
COMPARE
Immigrants from Peru
Tohono O'odham
Disability Age Over 75
Disability Age Over 75 Comparison
Immigrants from Peru
Tohono O'odham
46.9%
DISABILITY AGE OVER 75
84.1/ 100
METRIC RATING
147th/ 347
METRIC RANK
56.7%
DISABILITY AGE OVER 75
0.0/ 100
METRIC RATING
343rd/ 347
METRIC RANK
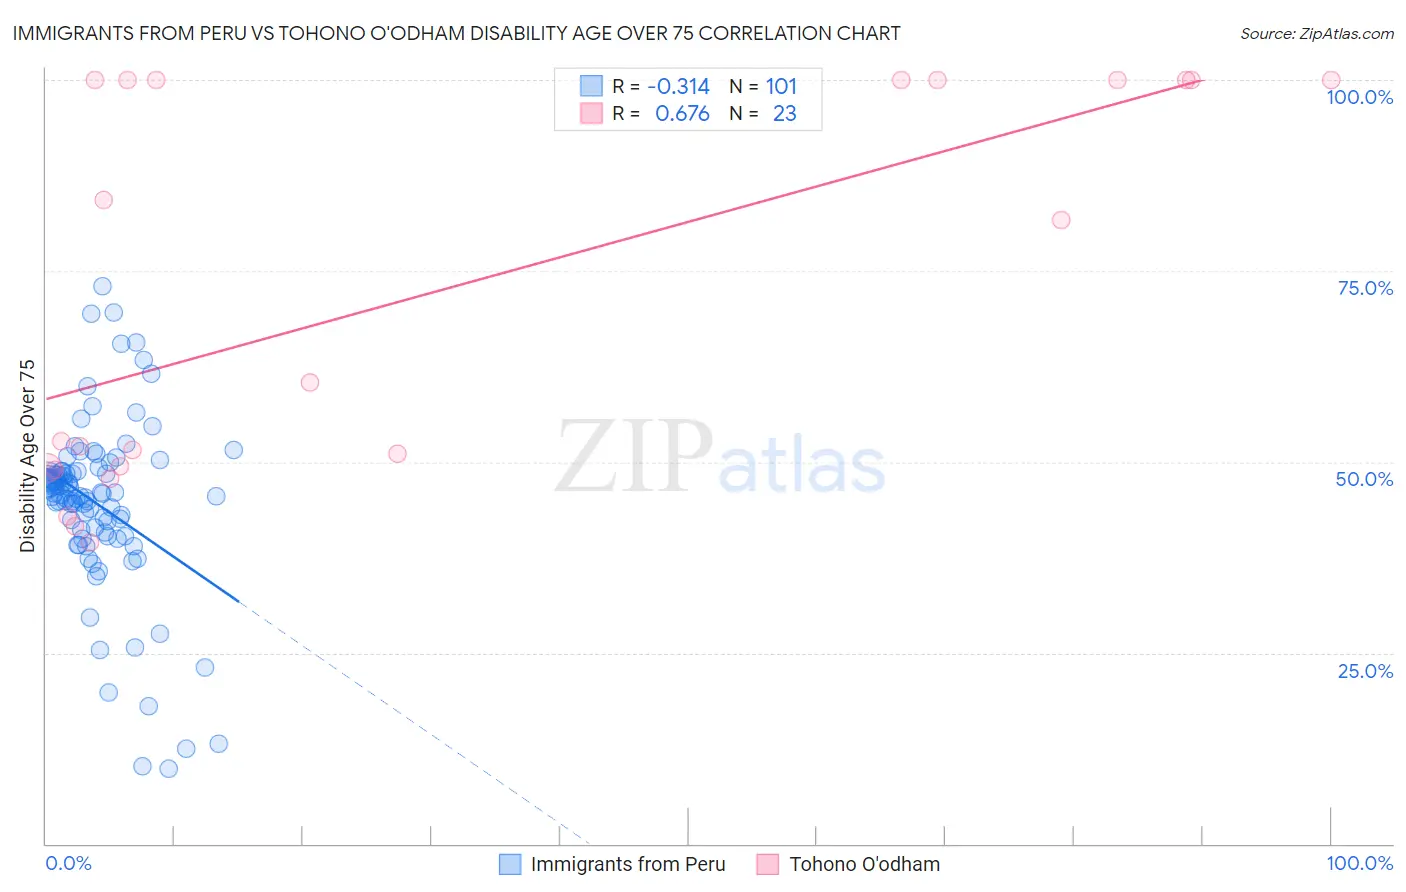
Immigrants from Peru vs Tohono O'odham Disability Age Over 75 Correlation Chart
The statistical analysis conducted on geographies consisting of 328,503,391 people shows a mild negative correlation between the proportion of Immigrants from Peru and percentage of population with a disability over the age of 75 in the United States with a correlation coefficient (R) of -0.314 and weighted average of 46.9%. Similarly, the statistical analysis conducted on geographies consisting of 58,667,406 people shows a significant positive correlation between the proportion of Tohono O'odham and percentage of population with a disability over the age of 75 in the United States with a correlation coefficient (R) of 0.676 and weighted average of 56.7%, a difference of 20.9%.
Disability Age Over 75 Correlation Summary
| Measurement | Immigrants from Peru | Tohono O'odham |
| Minimum | 9.9% | 39.4% |
| Maximum | 73.0% | 100.0% |
| Range | 63.1% | 60.6% |
| Mean | 44.5% | 71.9% |
| Median | 45.8% | 60.4% |
| Interquartile 25% (IQ1) | 40.6% | 49.2% |
| Interquartile 75% (IQ3) | 48.7% | 100.0% |
| Interquartile Range (IQR) | 8.1% | 50.8% |
| Standard Deviation (Sample) | 11.5% | 25.3% |
| Standard Deviation (Population) | 11.4% | 24.7% |
Similar Demographics by Disability Age Over 75
Demographics Similar to Immigrants from Peru by Disability Age Over 75
In terms of disability age over 75, the demographic groups most similar to Immigrants from Peru are Guyanese (46.9%, a difference of 0.010%), Costa Rican (46.9%, a difference of 0.020%), Venezuelan (46.9%, a difference of 0.040%), Bermudan (46.9%, a difference of 0.070%), and Asian (46.9%, a difference of 0.10%).
| Demographics | Rating | Rank | Disability Age Over 75 |
| Immigrants | Costa Rica | 87.4 /100 | #140 | Excellent 46.8% |
| Lebanese | 87.0 /100 | #141 | Excellent 46.8% |
| Peruvians | 86.5 /100 | #142 | Excellent 46.8% |
| Bermudans | 85.6 /100 | #143 | Excellent 46.9% |
| Venezuelans | 85.0 /100 | #144 | Excellent 46.9% |
| Costa Ricans | 84.5 /100 | #145 | Excellent 46.9% |
| Guyanese | 84.3 /100 | #146 | Excellent 46.9% |
| Immigrants | Peru | 84.1 /100 | #147 | Excellent 46.9% |
| Asians | 81.6 /100 | #148 | Excellent 46.9% |
| Welsh | 81.3 /100 | #149 | Excellent 47.0% |
| Immigrants | Russia | 79.3 /100 | #150 | Good 47.0% |
| French Canadians | 79.0 /100 | #151 | Good 47.0% |
| Immigrants | Asia | 76.5 /100 | #152 | Good 47.0% |
| Immigrants | Zaire | 74.8 /100 | #153 | Good 47.1% |
| Immigrants | Belarus | 74.8 /100 | #154 | Good 47.1% |
Demographics Similar to Tohono O'odham by Disability Age Over 75
In terms of disability age over 75, the demographic groups most similar to Tohono O'odham are Lumbee (56.2%, a difference of 0.83%), Houma (56.2%, a difference of 1.0%), Pueblo (55.9%, a difference of 1.5%), Pima (55.8%, a difference of 1.6%), and Colville (55.4%, a difference of 2.4%).
| Demographics | Rating | Rank | Disability Age Over 75 |
| Apache | 0.0 /100 | #333 | Tragic 53.6% |
| Alaskan Athabascans | 0.0 /100 | #334 | Tragic 54.0% |
| Kiowa | 0.0 /100 | #335 | Tragic 54.2% |
| Immigrants | Armenia | 0.0 /100 | #336 | Tragic 54.3% |
| Yuman | 0.0 /100 | #337 | Tragic 54.4% |
| Colville | 0.0 /100 | #338 | Tragic 55.4% |
| Pima | 0.0 /100 | #339 | Tragic 55.8% |
| Pueblo | 0.0 /100 | #340 | Tragic 55.9% |
| Houma | 0.0 /100 | #341 | Tragic 56.2% |
| Lumbee | 0.0 /100 | #342 | Tragic 56.2% |
| Tohono O'odham | 0.0 /100 | #343 | Tragic 56.7% |
| Navajo | 0.0 /100 | #344 | Tragic 58.3% |
| Inupiat | 0.0 /100 | #345 | Tragic 58.4% |
| Tsimshian | 0.0 /100 | #346 | Tragic 59.2% |
| Yup'ik | 0.0 /100 | #347 | Tragic 61.1% |