Immigrants from Yemen vs Tohono O'odham Disability Age Over 75
COMPARE
Immigrants from Yemen
Tohono O'odham
Disability Age Over 75
Disability Age Over 75 Comparison
Immigrants from Yemen
Tohono O'odham
52.0%
DISABILITY AGE OVER 75
0.0/ 100
METRIC RATING
323rd/ 347
METRIC RANK
56.7%
DISABILITY AGE OVER 75
0.0/ 100
METRIC RATING
343rd/ 347
METRIC RANK
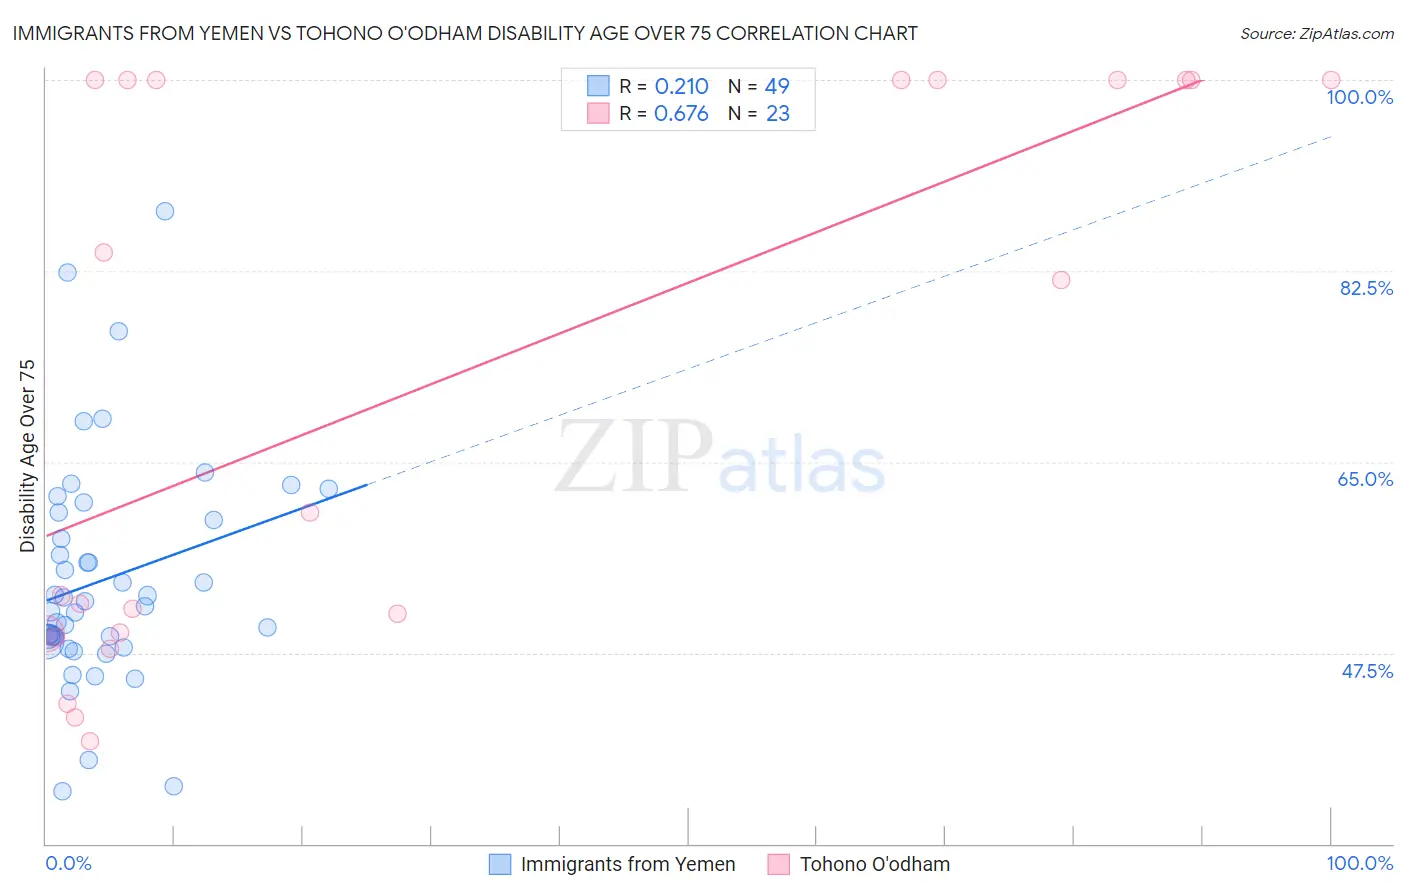
Immigrants from Yemen vs Tohono O'odham Disability Age Over 75 Correlation Chart
The statistical analysis conducted on geographies consisting of 82,401,520 people shows a weak positive correlation between the proportion of Immigrants from Yemen and percentage of population with a disability over the age of 75 in the United States with a correlation coefficient (R) of 0.210 and weighted average of 52.0%. Similarly, the statistical analysis conducted on geographies consisting of 58,667,406 people shows a significant positive correlation between the proportion of Tohono O'odham and percentage of population with a disability over the age of 75 in the United States with a correlation coefficient (R) of 0.676 and weighted average of 56.7%, a difference of 9.1%.
Disability Age Over 75 Correlation Summary
| Measurement | Immigrants from Yemen | Tohono O'odham |
| Minimum | 34.8% | 39.4% |
| Maximum | 88.0% | 100.0% |
| Range | 53.2% | 60.6% |
| Mean | 54.2% | 71.9% |
| Median | 51.8% | 60.4% |
| Interquartile 25% (IQ1) | 48.7% | 49.2% |
| Interquartile 75% (IQ3) | 60.0% | 100.0% |
| Interquartile Range (IQR) | 11.3% | 50.8% |
| Standard Deviation (Sample) | 10.4% | 25.3% |
| Standard Deviation (Population) | 10.3% | 24.7% |
Demographics Similar to Immigrants from Yemen and Tohono O'odham by Disability Age Over 75
In terms of disability age over 75, the demographic groups most similar to Immigrants from Yemen are Menominee (52.3%, a difference of 0.63%), Immigrants from Cabo Verde (52.4%, a difference of 0.80%), Ute (52.6%, a difference of 1.1%), Nepalese (52.6%, a difference of 1.2%), and Choctaw (52.7%, a difference of 1.4%). Similarly, the demographic groups most similar to Tohono O'odham are Lumbee (56.2%, a difference of 0.83%), Houma (56.2%, a difference of 1.0%), Pueblo (55.9%, a difference of 1.5%), Pima (55.8%, a difference of 1.6%), and Colville (55.4%, a difference of 2.4%).
| Demographics | Rating | Rank | Disability Age Over 75 |
| Immigrants | Yemen | 0.0 /100 | #323 | Tragic 52.0% |
| Menominee | 0.0 /100 | #324 | Tragic 52.3% |
| Immigrants | Cabo Verde | 0.0 /100 | #325 | Tragic 52.4% |
| Ute | 0.0 /100 | #326 | Tragic 52.6% |
| Nepalese | 0.0 /100 | #327 | Tragic 52.6% |
| Choctaw | 0.0 /100 | #328 | Tragic 52.7% |
| Alaska Natives | 0.0 /100 | #329 | Tragic 52.8% |
| Puerto Ricans | 0.0 /100 | #330 | Tragic 52.9% |
| Hopi | 0.0 /100 | #331 | Tragic 52.9% |
| Natives/Alaskans | 0.0 /100 | #332 | Tragic 53.1% |
| Apache | 0.0 /100 | #333 | Tragic 53.6% |
| Alaskan Athabascans | 0.0 /100 | #334 | Tragic 54.0% |
| Kiowa | 0.0 /100 | #335 | Tragic 54.2% |
| Immigrants | Armenia | 0.0 /100 | #336 | Tragic 54.3% |
| Yuman | 0.0 /100 | #337 | Tragic 54.4% |
| Colville | 0.0 /100 | #338 | Tragic 55.4% |
| Pima | 0.0 /100 | #339 | Tragic 55.8% |
| Pueblo | 0.0 /100 | #340 | Tragic 55.9% |
| Houma | 0.0 /100 | #341 | Tragic 56.2% |
| Lumbee | 0.0 /100 | #342 | Tragic 56.2% |
| Tohono O'odham | 0.0 /100 | #343 | Tragic 56.7% |