Immigrants from Peru vs Korean Vision Disability
COMPARE
Immigrants from Peru
Korean
Vision Disability
Vision Disability Comparison
Immigrants from Peru
Koreans
2.1%
VISION DISABILITY
89.5/ 100
METRIC RATING
126th/ 347
METRIC RANK
2.1%
VISION DISABILITY
94.1/ 100
METRIC RATING
108th/ 347
METRIC RANK
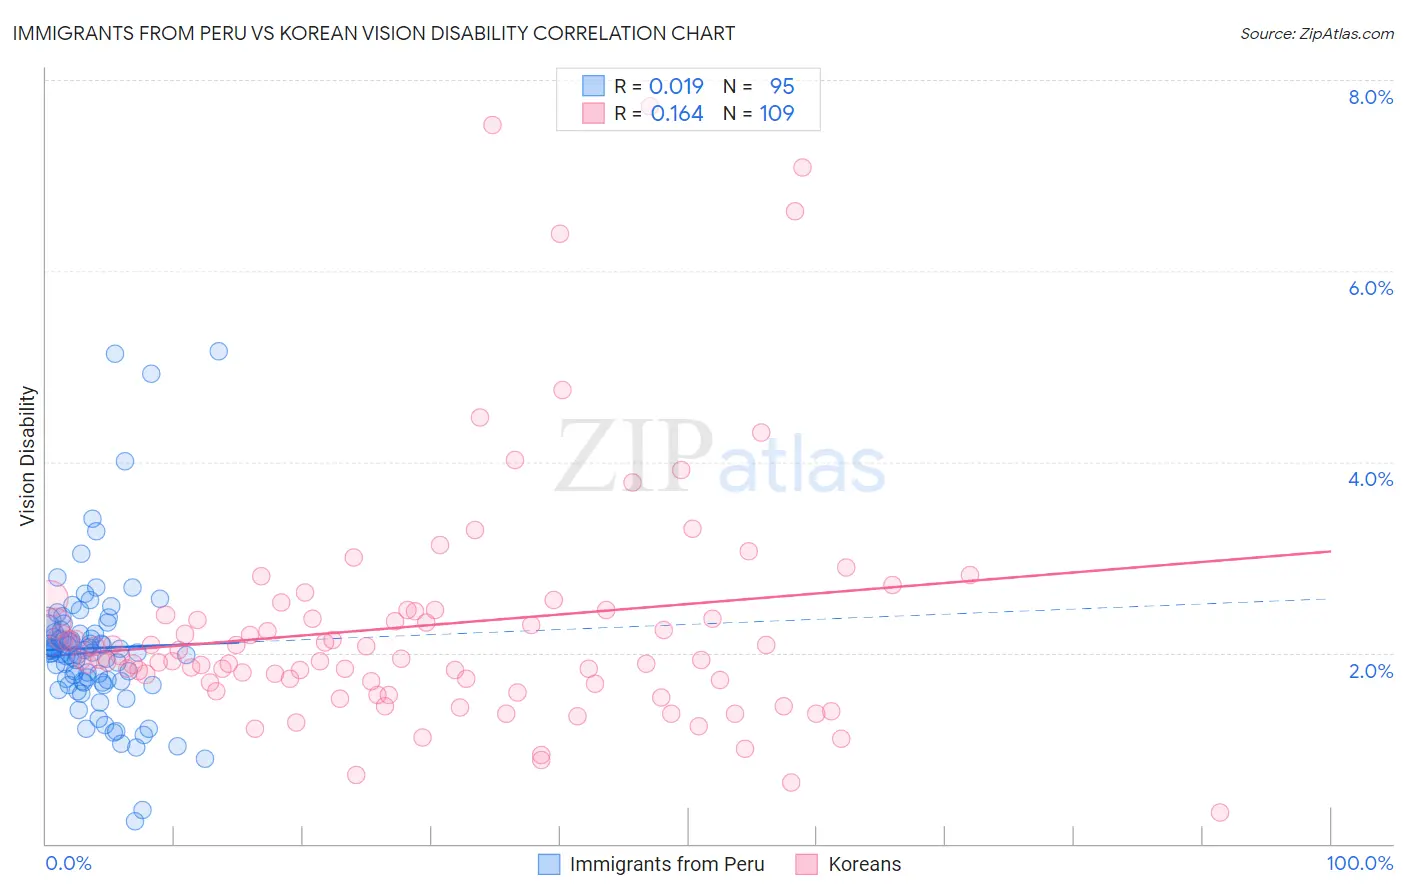
Immigrants from Peru vs Korean Vision Disability Correlation Chart
The statistical analysis conducted on geographies consisting of 328,732,029 people shows no correlation between the proportion of Immigrants from Peru and percentage of population with vision disability in the United States with a correlation coefficient (R) of 0.019 and weighted average of 2.1%. Similarly, the statistical analysis conducted on geographies consisting of 510,182,066 people shows a poor positive correlation between the proportion of Koreans and percentage of population with vision disability in the United States with a correlation coefficient (R) of 0.164 and weighted average of 2.1%, a difference of 1.0%.
Vision Disability Correlation Summary
| Measurement | Immigrants from Peru | Korean |
| Minimum | 0.23% | 0.33% |
| Maximum | 5.2% | 7.7% |
| Range | 4.9% | 7.4% |
| Mean | 2.0% | 2.3% |
| Median | 2.0% | 1.9% |
| Interquartile 25% (IQ1) | 1.7% | 1.7% |
| Interquartile 75% (IQ3) | 2.2% | 2.4% |
| Interquartile Range (IQR) | 0.55% | 0.76% |
| Standard Deviation (Sample) | 0.79% | 1.3% |
| Standard Deviation (Population) | 0.78% | 1.3% |
Demographics Similar to Immigrants from Peru and Koreans by Vision Disability
In terms of vision disability, the demographic groups most similar to Immigrants from Peru are Immigrants from Spain (2.1%, a difference of 0.040%), Immigrants from Venezuela (2.1%, a difference of 0.040%), Sudanese (2.1%, a difference of 0.060%), Immigrants from Ukraine (2.1%, a difference of 0.15%), and Immigrants from Albania (2.1%, a difference of 0.15%). Similarly, the demographic groups most similar to Koreans are Chilean (2.1%, a difference of 0.020%), Danish (2.1%, a difference of 0.030%), Immigrants from Armenia (2.1%, a difference of 0.090%), Peruvian (2.1%, a difference of 0.15%), and Immigrants from Denmark (2.1%, a difference of 0.30%).
| Demographics | Rating | Rank | Vision Disability |
| Danes | 94.2 /100 | #107 | Exceptional 2.1% |
| Koreans | 94.1 /100 | #108 | Exceptional 2.1% |
| Chileans | 94.0 /100 | #109 | Exceptional 2.1% |
| Immigrants | Armenia | 93.8 /100 | #110 | Exceptional 2.1% |
| Peruvians | 93.5 /100 | #111 | Exceptional 2.1% |
| Immigrants | Denmark | 92.9 /100 | #112 | Exceptional 2.1% |
| Kenyans | 92.5 /100 | #113 | Exceptional 2.1% |
| Croatians | 92.3 /100 | #114 | Exceptional 2.1% |
| Immigrants | Vietnam | 92.2 /100 | #115 | Exceptional 2.1% |
| Ugandans | 92.2 /100 | #116 | Exceptional 2.1% |
| Poles | 92.0 /100 | #117 | Exceptional 2.1% |
| Immigrants | Philippines | 91.4 /100 | #118 | Exceptional 2.1% |
| Immigrants | Uganda | 91.4 /100 | #119 | Exceptional 2.1% |
| Immigrants | Zimbabwe | 91.0 /100 | #120 | Exceptional 2.1% |
| Immigrants | Scotland | 90.4 /100 | #121 | Exceptional 2.1% |
| Immigrants | Ukraine | 90.4 /100 | #122 | Exceptional 2.1% |
| Immigrants | Albania | 90.4 /100 | #123 | Exceptional 2.1% |
| Immigrants | Spain | 89.8 /100 | #124 | Excellent 2.1% |
| Immigrants | Venezuela | 89.8 /100 | #125 | Excellent 2.1% |
| Immigrants | Peru | 89.5 /100 | #126 | Excellent 2.1% |
| Sudanese | 89.2 /100 | #127 | Excellent 2.1% |