Zimbabwean vs U.S. Virgin Islander Disability Age Under 5
COMPARE
Zimbabwean
U.S. Virgin Islander
Disability Age Under 5
Disability Age Under 5 Comparison
Zimbabweans
U.S. Virgin Islanders
1.2%
DISABILITY AGE UNDER 5
90.6/ 100
METRIC RATING
123rd/ 347
METRIC RANK
1.3%
DISABILITY AGE UNDER 5
34.4/ 100
METRIC RATING
195th/ 347
METRIC RANK
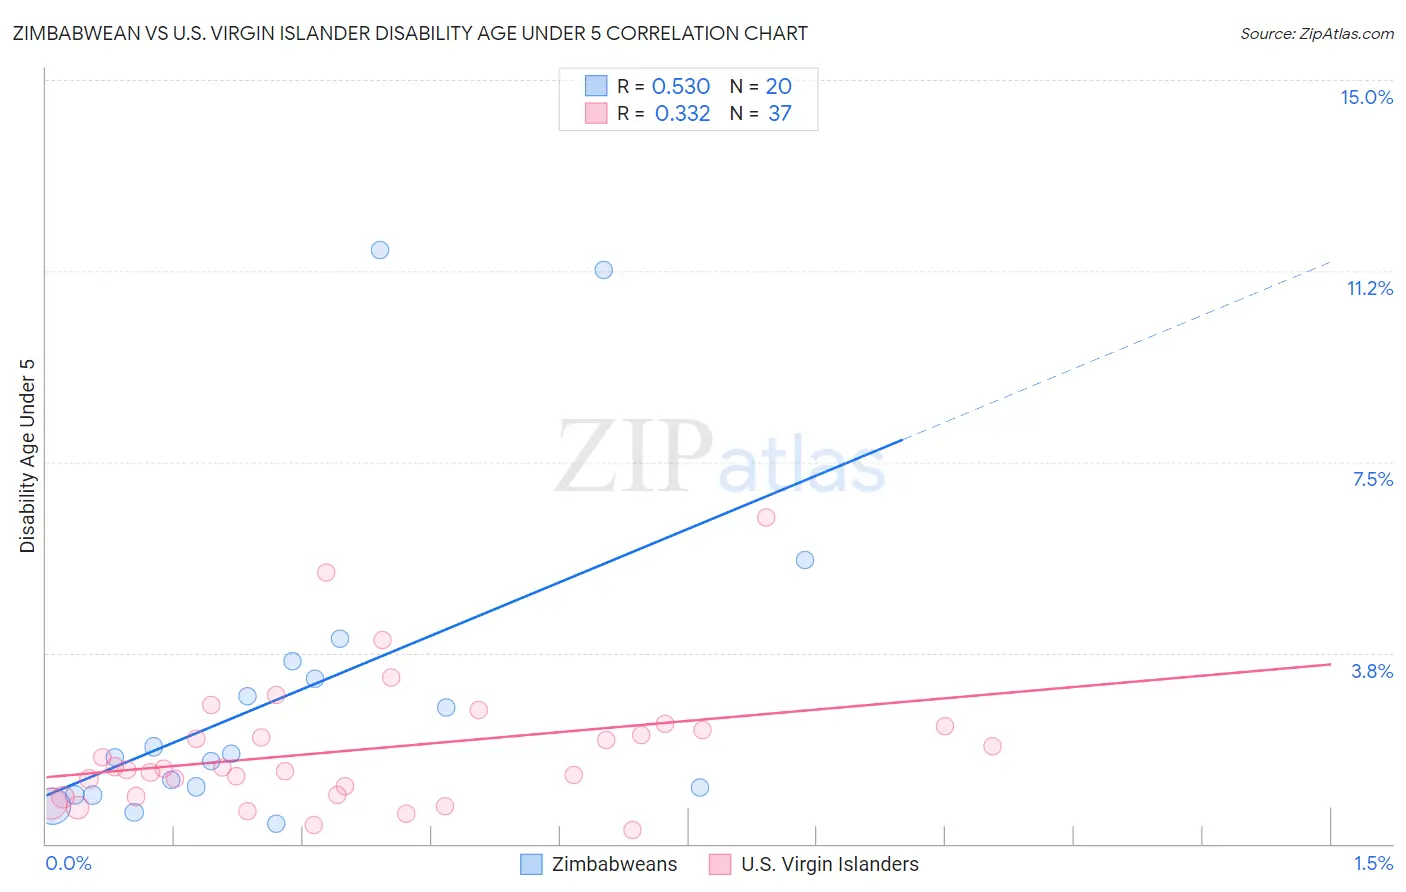
Zimbabwean vs U.S. Virgin Islander Disability Age Under 5 Correlation Chart
The statistical analysis conducted on geographies consisting of 56,916,571 people shows a substantial positive correlation between the proportion of Zimbabweans and percentage of population with a disability under the age of 5 in the United States with a correlation coefficient (R) of 0.530 and weighted average of 1.2%. Similarly, the statistical analysis conducted on geographies consisting of 67,886,708 people shows a mild positive correlation between the proportion of U.S. Virgin Islanders and percentage of population with a disability under the age of 5 in the United States with a correlation coefficient (R) of 0.332 and weighted average of 1.3%, a difference of 6.9%.
Disability Age Under 5 Correlation Summary
| Measurement | Zimbabwean | U.S. Virgin Islander |
| Minimum | 0.39% | 0.26% |
| Maximum | 11.7% | 6.4% |
| Range | 11.3% | 6.1% |
| Mean | 3.0% | 1.8% |
| Median | 1.7% | 1.5% |
| Interquartile 25% (IQ1) | 1.0% | 0.94% |
| Interquartile 75% (IQ3) | 3.4% | 2.3% |
| Interquartile Range (IQR) | 2.4% | 1.3% |
| Standard Deviation (Sample) | 3.2% | 1.3% |
| Standard Deviation (Population) | 3.1% | 1.3% |
Similar Demographics by Disability Age Under 5
Demographics Similar to Zimbabweans by Disability Age Under 5
In terms of disability age under 5, the demographic groups most similar to Zimbabweans are Immigrants from Cambodia (1.2%, a difference of 0.020%), Aleut (1.2%, a difference of 0.050%), Japanese (1.2%, a difference of 0.080%), Immigrants from Senegal (1.2%, a difference of 0.24%), and Central American (1.2%, a difference of 0.25%).
| Demographics | Rating | Rank | Disability Age Under 5 |
| Immigrants | Northern Africa | 93.8 /100 | #116 | Exceptional 1.2% |
| Immigrants | Philippines | 93.5 /100 | #117 | Exceptional 1.2% |
| Immigrants | Venezuela | 93.4 /100 | #118 | Exceptional 1.2% |
| Bhutanese | 92.5 /100 | #119 | Exceptional 1.2% |
| Immigrants | Eritrea | 92.3 /100 | #120 | Exceptional 1.2% |
| Immigrants | Senegal | 91.4 /100 | #121 | Exceptional 1.2% |
| Aleuts | 90.7 /100 | #122 | Exceptional 1.2% |
| Zimbabweans | 90.6 /100 | #123 | Exceptional 1.2% |
| Immigrants | Cambodia | 90.5 /100 | #124 | Exceptional 1.2% |
| Japanese | 90.3 /100 | #125 | Exceptional 1.2% |
| Central Americans | 89.7 /100 | #126 | Excellent 1.2% |
| Immigrants | Romania | 88.4 /100 | #127 | Excellent 1.2% |
| Immigrants | France | 88.4 /100 | #128 | Excellent 1.2% |
| Immigrants | Immigrants | 88.0 /100 | #129 | Excellent 1.2% |
| Koreans | 87.7 /100 | #130 | Excellent 1.2% |
Demographics Similar to U.S. Virgin Islanders by Disability Age Under 5
In terms of disability age under 5, the demographic groups most similar to U.S. Virgin Islanders are Immigrants from North Macedonia (1.3%, a difference of 0.020%), Immigrants from Sierra Leone (1.3%, a difference of 0.20%), Mexican American Indian (1.3%, a difference of 0.21%), Immigrants from Bosnia and Herzegovina (1.3%, a difference of 0.21%), and Immigrants from Laos (1.3%, a difference of 0.22%).
| Demographics | Rating | Rank | Disability Age Under 5 |
| Haitians | 39.9 /100 | #188 | Fair 1.3% |
| Peruvians | 37.6 /100 | #189 | Fair 1.3% |
| Immigrants | Laos | 36.6 /100 | #190 | Fair 1.3% |
| Mexican American Indians | 36.6 /100 | #191 | Fair 1.3% |
| Immigrants | Bosnia and Herzegovina | 36.5 /100 | #192 | Fair 1.3% |
| Immigrants | Sierra Leone | 36.5 /100 | #193 | Fair 1.3% |
| Immigrants | North Macedonia | 34.7 /100 | #194 | Fair 1.3% |
| U.S. Virgin Islanders | 34.4 /100 | #195 | Fair 1.3% |
| Immigrants | Belgium | 31.4 /100 | #196 | Fair 1.3% |
| Immigrants | Somalia | 31.3 /100 | #197 | Fair 1.3% |
| Immigrants | Norway | 31.1 /100 | #198 | Fair 1.3% |
| Jamaicans | 30.7 /100 | #199 | Fair 1.3% |
| Immigrants | Lithuania | 27.2 /100 | #200 | Fair 1.3% |
| Immigrants | Italy | 25.4 /100 | #201 | Fair 1.3% |
| Arapaho | 24.1 /100 | #202 | Fair 1.3% |