Immigrants from Northern Europe vs Iroquois Self-Care Disability
COMPARE
Immigrants from Northern Europe
Iroquois
Self-Care Disability
Self-Care Disability Comparison
Immigrants from Northern Europe
Iroquois
2.3%
SELF-CARE DISABILITY
99.2/ 100
METRIC RATING
70th/ 347
METRIC RANK
2.7%
SELF-CARE DISABILITY
0.1/ 100
METRIC RATING
279th/ 347
METRIC RANK
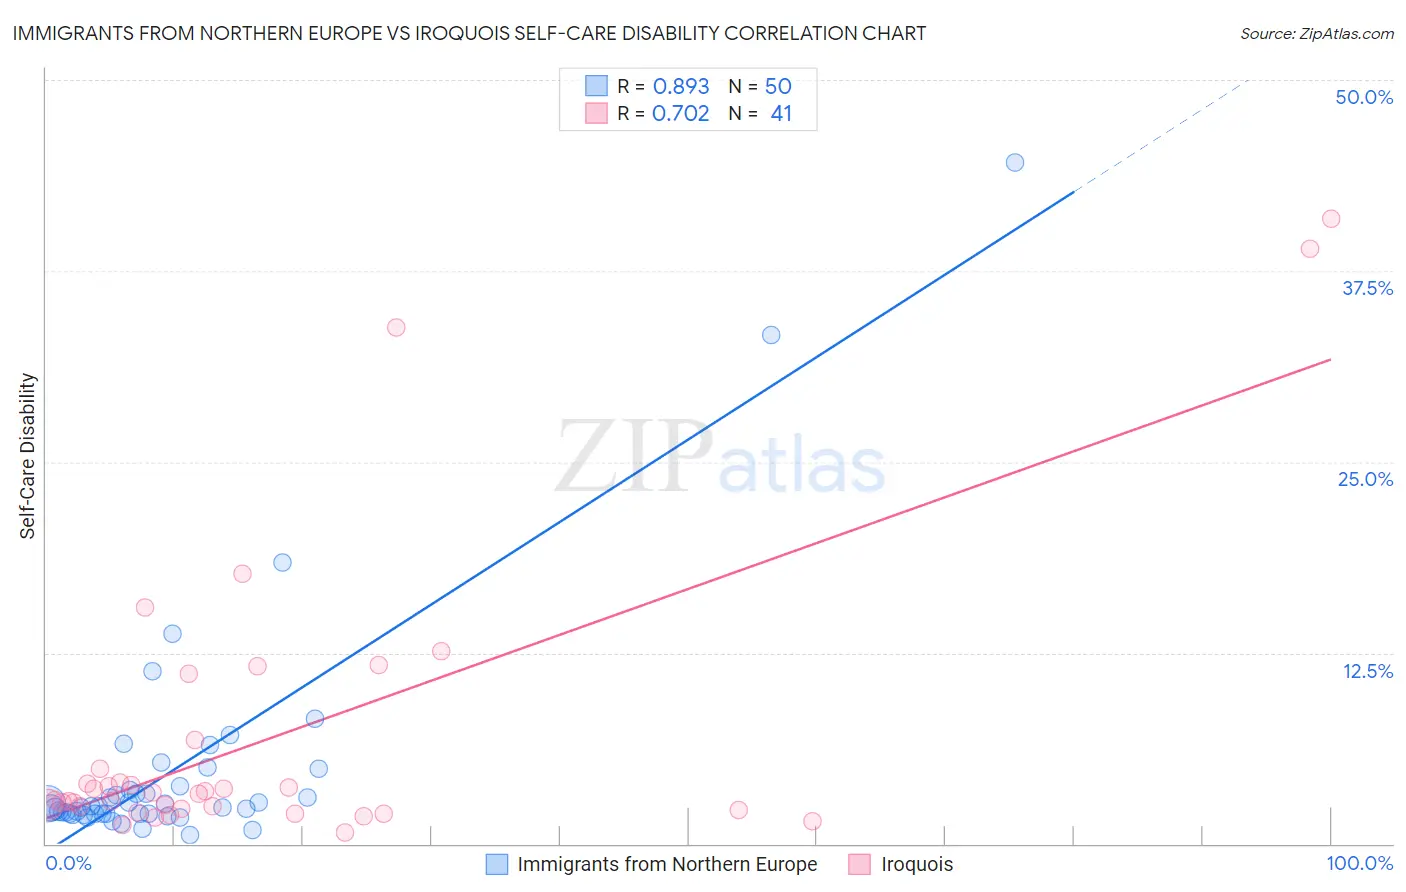
Immigrants from Northern Europe vs Iroquois Self-Care Disability Correlation Chart
The statistical analysis conducted on geographies consisting of 476,375,599 people shows a very strong positive correlation between the proportion of Immigrants from Northern Europe and percentage of population with self-care disability in the United States with a correlation coefficient (R) of 0.893 and weighted average of 2.3%. Similarly, the statistical analysis conducted on geographies consisting of 207,147,261 people shows a strong positive correlation between the proportion of Iroquois and percentage of population with self-care disability in the United States with a correlation coefficient (R) of 0.702 and weighted average of 2.7%, a difference of 15.6%.
Self-Care Disability Correlation Summary
| Measurement | Immigrants from Northern Europe | Iroquois |
| Minimum | 0.56% | 0.76% |
| Maximum | 44.6% | 40.9% |
| Range | 44.0% | 40.1% |
| Mean | 5.0% | 7.0% |
| Median | 2.4% | 3.3% |
| Interquartile 25% (IQ1) | 2.0% | 2.3% |
| Interquartile 75% (IQ3) | 3.8% | 5.9% |
| Interquartile Range (IQR) | 1.8% | 3.6% |
| Standard Deviation (Sample) | 7.8% | 9.7% |
| Standard Deviation (Population) | 7.7% | 9.6% |
Similar Demographics by Self-Care Disability
Demographics Similar to Immigrants from Northern Europe by Self-Care Disability
In terms of self-care disability, the demographic groups most similar to Immigrants from Northern Europe are Immigrants from Zaire (2.3%, a difference of 0.040%), Immigrants from Norway (2.3%, a difference of 0.040%), Asian (2.3%, a difference of 0.040%), Eastern European (2.3%, a difference of 0.070%), and Immigrants from Egypt (2.3%, a difference of 0.090%).
| Demographics | Rating | Rank | Self-Care Disability |
| Mongolians | 99.3 /100 | #63 | Exceptional 2.3% |
| Swedes | 99.3 /100 | #64 | Exceptional 2.3% |
| Brazilians | 99.3 /100 | #65 | Exceptional 2.3% |
| Immigrants | Argentina | 99.3 /100 | #66 | Exceptional 2.3% |
| South Africans | 99.3 /100 | #67 | Exceptional 2.3% |
| Immigrants | Zaire | 99.2 /100 | #68 | Exceptional 2.3% |
| Immigrants | Norway | 99.2 /100 | #69 | Exceptional 2.3% |
| Immigrants | Northern Europe | 99.2 /100 | #70 | Exceptional 2.3% |
| Asians | 99.2 /100 | #71 | Exceptional 2.3% |
| Eastern Europeans | 99.2 /100 | #72 | Exceptional 2.3% |
| Immigrants | Egypt | 99.1 /100 | #73 | Exceptional 2.3% |
| Immigrants | Switzerland | 99.1 /100 | #74 | Exceptional 2.3% |
| Immigrants | Netherlands | 99.1 /100 | #75 | Exceptional 2.3% |
| Immigrants | China | 99.1 /100 | #76 | Exceptional 2.3% |
| Immigrants | Middle Africa | 99.0 /100 | #77 | Exceptional 2.3% |
Demographics Similar to Iroquois by Self-Care Disability
In terms of self-care disability, the demographic groups most similar to Iroquois are Hispanic or Latino (2.7%, a difference of 0.020%), Ottawa (2.7%, a difference of 0.10%), Immigrants from Ukraine (2.7%, a difference of 0.18%), Immigrants from Iraq (2.7%, a difference of 0.18%), and Apache (2.7%, a difference of 0.20%).
| Demographics | Rating | Rank | Self-Care Disability |
| Immigrants | Laos | 0.1 /100 | #272 | Tragic 2.7% |
| Mexicans | 0.1 /100 | #273 | Tragic 2.7% |
| Yakama | 0.1 /100 | #274 | Tragic 2.7% |
| Immigrants | Trinidad and Tobago | 0.1 /100 | #275 | Tragic 2.7% |
| Japanese | 0.1 /100 | #276 | Tragic 2.7% |
| Immigrants | Ukraine | 0.1 /100 | #277 | Tragic 2.7% |
| Ottawa | 0.1 /100 | #278 | Tragic 2.7% |
| Iroquois | 0.1 /100 | #279 | Tragic 2.7% |
| Hispanics or Latinos | 0.1 /100 | #280 | Tragic 2.7% |
| Immigrants | Iraq | 0.0 /100 | #281 | Tragic 2.7% |
| Apache | 0.0 /100 | #282 | Tragic 2.7% |
| Delaware | 0.0 /100 | #283 | Tragic 2.7% |
| Fijians | 0.0 /100 | #284 | Tragic 2.7% |
| Jamaicans | 0.0 /100 | #285 | Tragic 2.7% |
| French American Indians | 0.0 /100 | #286 | Tragic 2.7% |