Immigrants from Northern Africa vs Zimbabwean Female Disability
COMPARE
Immigrants from Northern Africa
Zimbabwean
Female Disability
Female Disability Comparison
Immigrants from Northern Africa
Zimbabweans
11.5%
FEMALE DISABILITY
99.8/ 100
METRIC RATING
68th/ 347
METRIC RANK
11.3%
FEMALE DISABILITY
100.0/ 100
METRIC RATING
48th/ 347
METRIC RANK
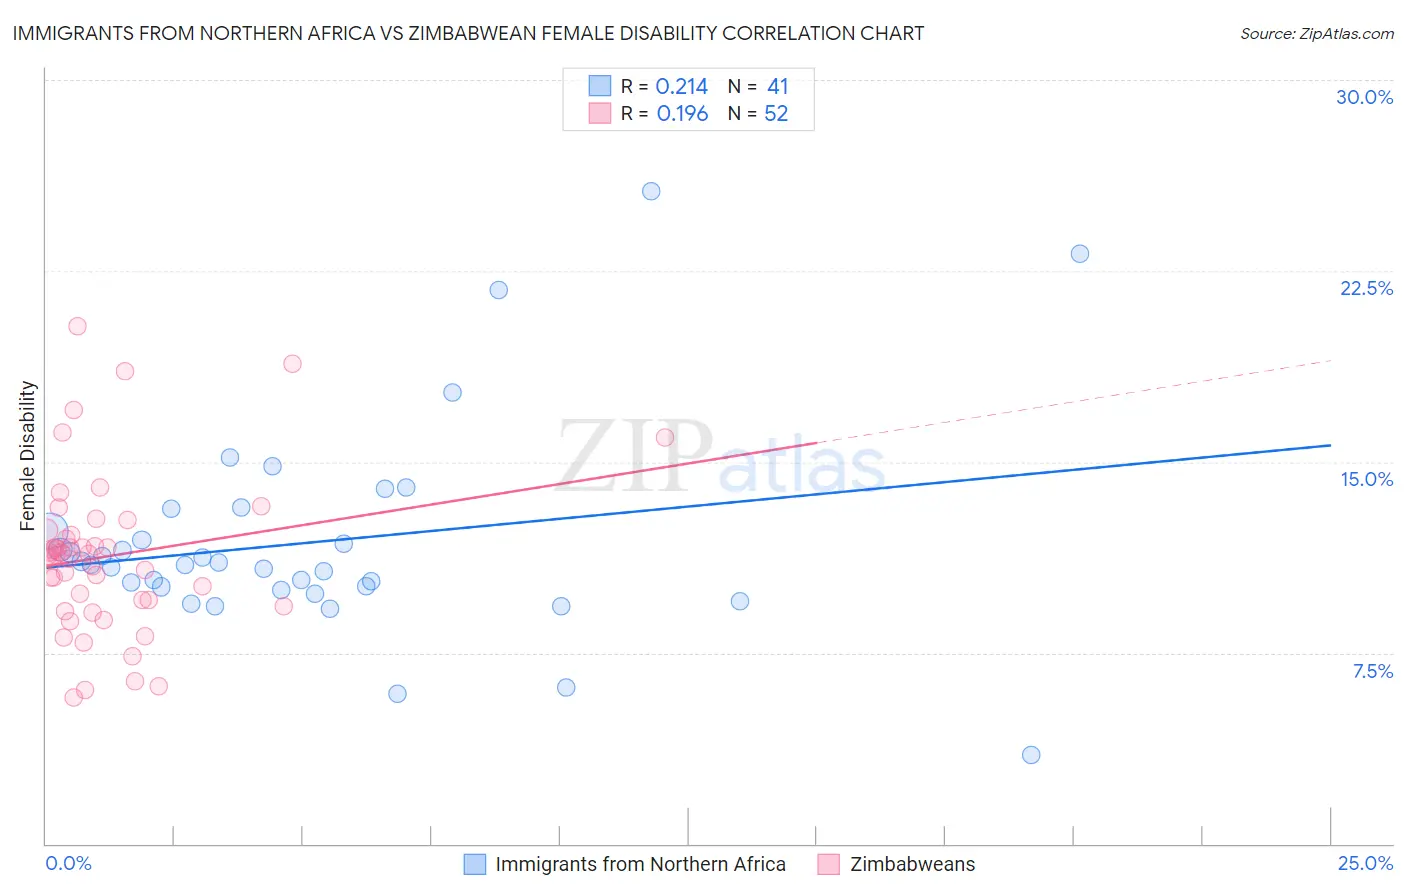
Immigrants from Northern Africa vs Zimbabwean Female Disability Correlation Chart
The statistical analysis conducted on geographies consisting of 321,175,054 people shows a weak positive correlation between the proportion of Immigrants from Northern Africa and percentage of females with a disability in the United States with a correlation coefficient (R) of 0.214 and weighted average of 11.5%. Similarly, the statistical analysis conducted on geographies consisting of 69,206,785 people shows a poor positive correlation between the proportion of Zimbabweans and percentage of females with a disability in the United States with a correlation coefficient (R) of 0.196 and weighted average of 11.3%, a difference of 1.7%.
Female Disability Correlation Summary
| Measurement | Immigrants from Northern Africa | Zimbabwean |
| Minimum | 3.5% | 5.7% |
| Maximum | 25.6% | 20.3% |
| Range | 22.1% | 14.6% |
| Mean | 11.8% | 11.3% |
| Median | 10.9% | 11.3% |
| Interquartile 25% (IQ1) | 10.0% | 9.5% |
| Interquartile 75% (IQ3) | 12.7% | 12.2% |
| Interquartile Range (IQR) | 2.7% | 2.8% |
| Standard Deviation (Sample) | 4.1% | 3.1% |
| Standard Deviation (Population) | 4.1% | 3.1% |
Demographics Similar to Immigrants from Northern Africa and Zimbabweans by Female Disability
In terms of female disability, the demographic groups most similar to Immigrants from Northern Africa are Immigrants from Vietnam (11.5%, a difference of 0.020%), Salvadoran (11.5%, a difference of 0.060%), Immigrants from South America (11.4%, a difference of 0.24%), Immigrants from El Salvador (11.4%, a difference of 0.26%), and Immigrants from Colombia (11.4%, a difference of 0.32%). Similarly, the demographic groups most similar to Zimbabweans are Tongan (11.3%, a difference of 0.010%), Inupiat (11.3%, a difference of 0.24%), Immigrants from Belgium (11.3%, a difference of 0.32%), Immigrants from Peru (11.3%, a difference of 0.43%), and Immigrants from Saudi Arabia (11.3%, a difference of 0.48%).
| Demographics | Rating | Rank | Female Disability |
| Zimbabweans | 100.0 /100 | #48 | Exceptional 11.3% |
| Tongans | 100.0 /100 | #49 | Exceptional 11.3% |
| Inupiat | 100.0 /100 | #50 | Exceptional 11.3% |
| Immigrants | Belgium | 100.0 /100 | #51 | Exceptional 11.3% |
| Immigrants | Peru | 99.9 /100 | #52 | Exceptional 11.3% |
| Immigrants | Saudi Arabia | 99.9 /100 | #53 | Exceptional 11.3% |
| Peruvians | 99.9 /100 | #54 | Exceptional 11.3% |
| Bulgarians | 99.9 /100 | #55 | Exceptional 11.3% |
| Taiwanese | 99.9 /100 | #56 | Exceptional 11.4% |
| South Americans | 99.9 /100 | #57 | Exceptional 11.4% |
| Laotians | 99.9 /100 | #58 | Exceptional 11.4% |
| Immigrants | Spain | 99.9 /100 | #59 | Exceptional 11.4% |
| Immigrants | Bulgaria | 99.9 /100 | #60 | Exceptional 11.4% |
| Immigrants | France | 99.9 /100 | #61 | Exceptional 11.4% |
| Sri Lankans | 99.9 /100 | #62 | Exceptional 11.4% |
| Immigrants | Colombia | 99.9 /100 | #63 | Exceptional 11.4% |
| Immigrants | El Salvador | 99.9 /100 | #64 | Exceptional 11.4% |
| Immigrants | South America | 99.9 /100 | #65 | Exceptional 11.4% |
| Salvadorans | 99.8 /100 | #66 | Exceptional 11.5% |
| Immigrants | Vietnam | 99.8 /100 | #67 | Exceptional 11.5% |
| Immigrants | Northern Africa | 99.8 /100 | #68 | Exceptional 11.5% |