Immigrants from Northern Africa vs Bolivian Female Disability
COMPARE
Immigrants from Northern Africa
Bolivian
Female Disability
Female Disability Comparison
Immigrants from Northern Africa
Bolivians
11.5%
FEMALE DISABILITY
99.8/ 100
METRIC RATING
68th/ 347
METRIC RANK
10.4%
FEMALE DISABILITY
100.0/ 100
METRIC RATING
6th/ 347
METRIC RANK
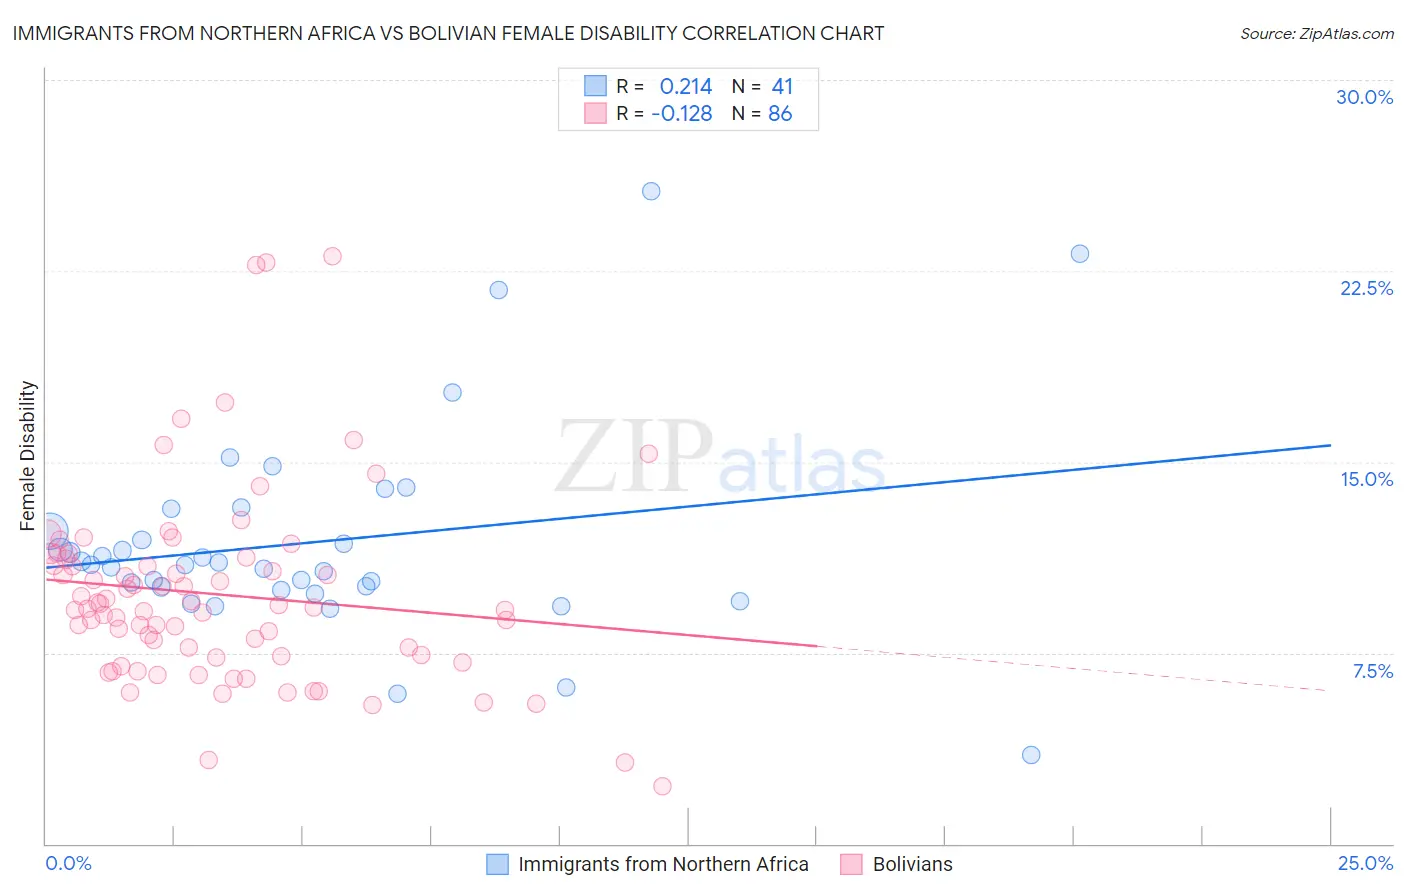
Immigrants from Northern Africa vs Bolivian Female Disability Correlation Chart
The statistical analysis conducted on geographies consisting of 321,175,054 people shows a weak positive correlation between the proportion of Immigrants from Northern Africa and percentage of females with a disability in the United States with a correlation coefficient (R) of 0.214 and weighted average of 11.5%. Similarly, the statistical analysis conducted on geographies consisting of 184,658,478 people shows a poor negative correlation between the proportion of Bolivians and percentage of females with a disability in the United States with a correlation coefficient (R) of -0.128 and weighted average of 10.4%, a difference of 10.8%.
Female Disability Correlation Summary
| Measurement | Immigrants from Northern Africa | Bolivian |
| Minimum | 3.5% | 2.3% |
| Maximum | 25.6% | 23.1% |
| Range | 22.1% | 20.8% |
| Mean | 11.8% | 9.8% |
| Median | 10.9% | 9.2% |
| Interquartile 25% (IQ1) | 10.0% | 7.4% |
| Interquartile 75% (IQ3) | 12.7% | 11.2% |
| Interquartile Range (IQR) | 2.7% | 3.8% |
| Standard Deviation (Sample) | 4.1% | 3.8% |
| Standard Deviation (Population) | 4.1% | 3.8% |
Similar Demographics by Female Disability
Demographics Similar to Immigrants from Northern Africa by Female Disability
In terms of female disability, the demographic groups most similar to Immigrants from Northern Africa are Immigrants from Vietnam (11.5%, a difference of 0.020%), Salvadoran (11.5%, a difference of 0.060%), Colombian (11.5%, a difference of 0.070%), Immigrants from Chile (11.5%, a difference of 0.080%), and Immigrants from Ireland (11.5%, a difference of 0.13%).
| Demographics | Rating | Rank | Female Disability |
| Immigrants | France | 99.9 /100 | #61 | Exceptional 11.4% |
| Sri Lankans | 99.9 /100 | #62 | Exceptional 11.4% |
| Immigrants | Colombia | 99.9 /100 | #63 | Exceptional 11.4% |
| Immigrants | El Salvador | 99.9 /100 | #64 | Exceptional 11.4% |
| Immigrants | South America | 99.9 /100 | #65 | Exceptional 11.4% |
| Salvadorans | 99.8 /100 | #66 | Exceptional 11.5% |
| Immigrants | Vietnam | 99.8 /100 | #67 | Exceptional 11.5% |
| Immigrants | Northern Africa | 99.8 /100 | #68 | Exceptional 11.5% |
| Colombians | 99.8 /100 | #69 | Exceptional 11.5% |
| Immigrants | Chile | 99.8 /100 | #70 | Exceptional 11.5% |
| Immigrants | Ireland | 99.8 /100 | #71 | Exceptional 11.5% |
| Chileans | 99.8 /100 | #72 | Exceptional 11.5% |
| Immigrants | Switzerland | 99.8 /100 | #73 | Exceptional 11.5% |
| Bhutanese | 99.8 /100 | #74 | Exceptional 11.5% |
| Immigrants | Lebanon | 99.7 /100 | #75 | Exceptional 11.5% |
Demographics Similar to Bolivians by Female Disability
In terms of female disability, the demographic groups most similar to Bolivians are Immigrants from Singapore (10.4%, a difference of 0.78%), Immigrants from Bolivia (10.3%, a difference of 0.91%), Immigrants from South Central Asia (10.5%, a difference of 1.0%), Thai (10.2%, a difference of 1.7%), and Iranian (10.6%, a difference of 1.9%).
| Demographics | Rating | Rank | Female Disability |
| Immigrants | India | 100.0 /100 | #1 | Exceptional 10.0% |
| Filipinos | 100.0 /100 | #2 | Exceptional 10.1% |
| Immigrants | Taiwan | 100.0 /100 | #3 | Exceptional 10.1% |
| Thais | 100.0 /100 | #4 | Exceptional 10.2% |
| Immigrants | Bolivia | 100.0 /100 | #5 | Exceptional 10.3% |
| Bolivians | 100.0 /100 | #6 | Exceptional 10.4% |
| Immigrants | Singapore | 100.0 /100 | #7 | Exceptional 10.4% |
| Immigrants | South Central Asia | 100.0 /100 | #8 | Exceptional 10.5% |
| Iranians | 100.0 /100 | #9 | Exceptional 10.6% |
| Immigrants | Hong Kong | 100.0 /100 | #10 | Exceptional 10.6% |
| Immigrants | Korea | 100.0 /100 | #11 | Exceptional 10.6% |
| Immigrants | Israel | 100.0 /100 | #12 | Exceptional 10.7% |
| Immigrants | Eastern Asia | 100.0 /100 | #13 | Exceptional 10.7% |
| Immigrants | China | 100.0 /100 | #14 | Exceptional 10.7% |
| Burmese | 100.0 /100 | #15 | Exceptional 10.7% |