Immigrants from Syria vs Zimbabwean Female Disability
COMPARE
Immigrants from Syria
Zimbabwean
Female Disability
Female Disability Comparison
Immigrants from Syria
Zimbabweans
11.9%
FEMALE DISABILITY
94.6/ 100
METRIC RATING
132nd/ 347
METRIC RANK
11.3%
FEMALE DISABILITY
100.0/ 100
METRIC RATING
48th/ 347
METRIC RANK
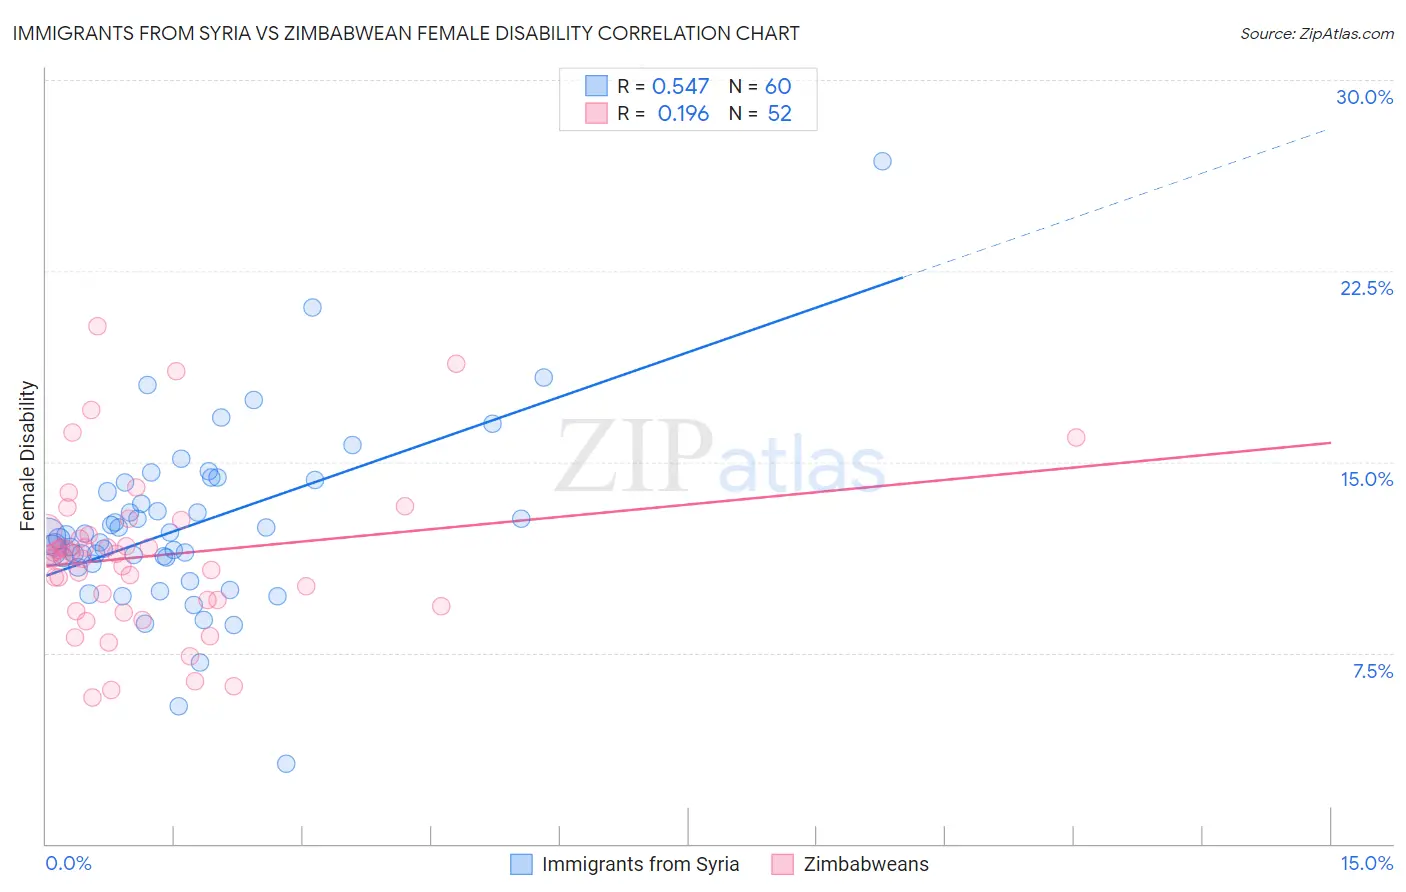
Immigrants from Syria vs Zimbabwean Female Disability Correlation Chart
The statistical analysis conducted on geographies consisting of 174,112,013 people shows a substantial positive correlation between the proportion of Immigrants from Syria and percentage of females with a disability in the United States with a correlation coefficient (R) of 0.547 and weighted average of 11.9%. Similarly, the statistical analysis conducted on geographies consisting of 69,206,785 people shows a poor positive correlation between the proportion of Zimbabweans and percentage of females with a disability in the United States with a correlation coefficient (R) of 0.196 and weighted average of 11.3%, a difference of 5.3%.
Female Disability Correlation Summary
| Measurement | Immigrants from Syria | Zimbabwean |
| Minimum | 3.1% | 5.7% |
| Maximum | 26.8% | 20.3% |
| Range | 23.7% | 14.6% |
| Mean | 12.5% | 11.3% |
| Median | 12.0% | 11.3% |
| Interquartile 25% (IQ1) | 11.1% | 9.5% |
| Interquartile 75% (IQ3) | 14.0% | 12.2% |
| Interquartile Range (IQR) | 2.9% | 2.8% |
| Standard Deviation (Sample) | 3.5% | 3.1% |
| Standard Deviation (Population) | 3.5% | 3.1% |
Similar Demographics by Female Disability
Demographics Similar to Immigrants from Syria by Female Disability
In terms of female disability, the demographic groups most similar to Immigrants from Syria are Kenyan (11.9%, a difference of 0.010%), Immigrants from Nicaragua (11.9%, a difference of 0.010%), Central American (11.9%, a difference of 0.080%), Arab (11.9%, a difference of 0.10%), and Ugandan (11.9%, a difference of 0.10%).
| Demographics | Rating | Rank | Female Disability |
| Immigrants | Italy | 96.4 /100 | #125 | Exceptional 11.8% |
| Immigrants | Europe | 96.2 /100 | #126 | Exceptional 11.8% |
| South American Indians | 95.8 /100 | #127 | Exceptional 11.8% |
| Immigrants | Latvia | 95.6 /100 | #128 | Exceptional 11.8% |
| Macedonians | 95.5 /100 | #129 | Exceptional 11.8% |
| Nicaraguans | 95.2 /100 | #130 | Exceptional 11.9% |
| Arabs | 95.1 /100 | #131 | Exceptional 11.9% |
| Immigrants | Syria | 94.6 /100 | #132 | Exceptional 11.9% |
| Kenyans | 94.5 /100 | #133 | Exceptional 11.9% |
| Immigrants | Nicaragua | 94.5 /100 | #134 | Exceptional 11.9% |
| Central Americans | 94.2 /100 | #135 | Exceptional 11.9% |
| Ugandans | 94.0 /100 | #136 | Exceptional 11.9% |
| Immigrants | Norway | 93.8 /100 | #137 | Exceptional 11.9% |
| Ecuadorians | 93.4 /100 | #138 | Exceptional 11.9% |
| Immigrants | Hungary | 92.8 /100 | #139 | Exceptional 11.9% |
Demographics Similar to Zimbabweans by Female Disability
In terms of female disability, the demographic groups most similar to Zimbabweans are Jordanian (11.3%, a difference of 0.0%), Tongan (11.3%, a difference of 0.010%), Immigrants from Nepal (11.3%, a difference of 0.020%), Immigrants from Sweden (11.3%, a difference of 0.070%), and Cambodian (11.3%, a difference of 0.11%).
| Demographics | Rating | Rank | Female Disability |
| Paraguayans | 100.0 /100 | #41 | Exceptional 11.2% |
| Israelis | 100.0 /100 | #42 | Exceptional 11.2% |
| Afghans | 100.0 /100 | #43 | Exceptional 11.2% |
| Cambodians | 100.0 /100 | #44 | Exceptional 11.3% |
| Immigrants | Sweden | 100.0 /100 | #45 | Exceptional 11.3% |
| Immigrants | Nepal | 100.0 /100 | #46 | Exceptional 11.3% |
| Jordanians | 100.0 /100 | #47 | Exceptional 11.3% |
| Zimbabweans | 100.0 /100 | #48 | Exceptional 11.3% |
| Tongans | 100.0 /100 | #49 | Exceptional 11.3% |
| Inupiat | 100.0 /100 | #50 | Exceptional 11.3% |
| Immigrants | Belgium | 100.0 /100 | #51 | Exceptional 11.3% |
| Immigrants | Peru | 99.9 /100 | #52 | Exceptional 11.3% |
| Immigrants | Saudi Arabia | 99.9 /100 | #53 | Exceptional 11.3% |
| Peruvians | 99.9 /100 | #54 | Exceptional 11.3% |
| Bulgarians | 99.9 /100 | #55 | Exceptional 11.3% |