Immigrants from Northern Africa vs South African Disability Age 5 to 17
COMPARE
Immigrants from Northern Africa
South African
Disability Age 5 to 17
Disability Age 5 to 17 Comparison
Immigrants from Northern Africa
South Africans
5.3%
DISABILITY AGE 5 TO 17
98.1/ 100
METRIC RATING
109th/ 347
METRIC RANK
5.5%
DISABILITY AGE 5 TO 17
73.3/ 100
METRIC RATING
160th/ 347
METRIC RANK
Immigrants from Northern Africa vs South African Disability Age 5 to 17 Correlation Chart
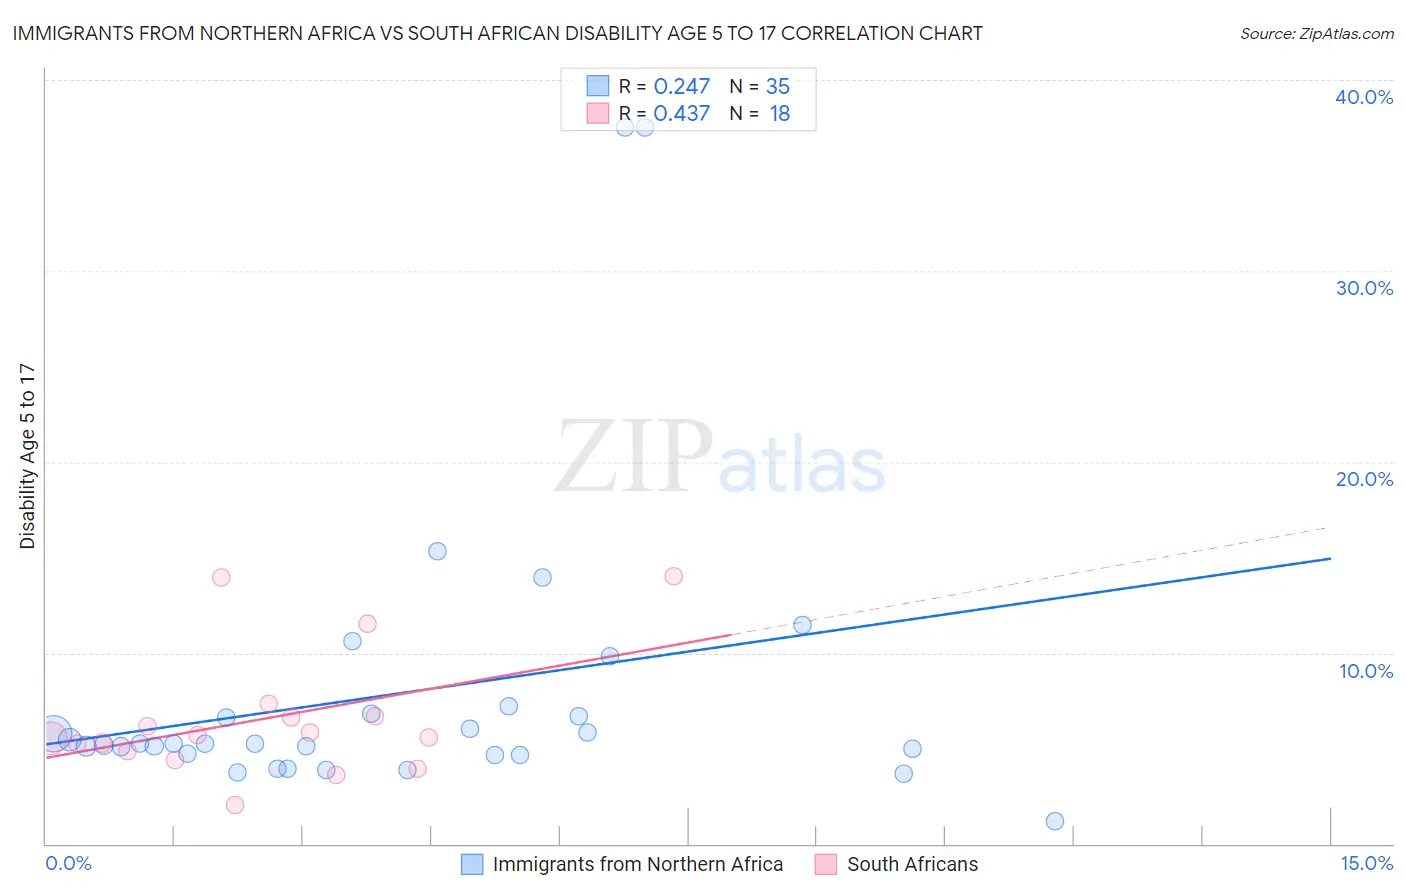
The statistical analysis conducted on geographies consisting of 319,281,932 people shows a weak positive correlation between the proportion of Immigrants from Northern Africa and percentage of population with a disability between the ages 5 and 17 in the United States with a correlation coefficient (R) of 0.247 and weighted average of 5.3%. Similarly, the statistical analysis conducted on geographies consisting of 181,855,258 people shows a moderate positive correlation between the proportion of South Africans and percentage of population with a disability between the ages 5 and 17 in the United States with a correlation coefficient (R) of 0.437 and weighted average of 5.5%, a difference of 3.8%.
Disability Age 5 to 17 Correlation Summary
| Measurement | Immigrants from Northern Africa | South African |
| Minimum | 1.2% | 2.0% |
| Maximum | 37.5% | 14.0% |
| Range | 36.3% | 12.0% |
| Mean | 7.9% | 6.6% |
| Median | 5.2% | 5.6% |
| Interquartile 25% (IQ1) | 4.6% | 4.9% |
| Interquartile 75% (IQ3) | 6.8% | 6.7% |
| Interquartile Range (IQR) | 2.2% | 1.8% |
| Standard Deviation (Sample) | 7.9% | 3.3% |
| Standard Deviation (Population) | 7.8% | 3.2% |
Similar Demographics by Disability Age 5 to 17
Demographics Similar to Immigrants from Northern Africa by Disability Age 5 to 17
In terms of disability age 5 to 17, the demographic groups most similar to Immigrants from Northern Africa are Immigrants from South Africa (5.3%, a difference of 0.040%), Immigrants from Eritrea (5.3%, a difference of 0.040%), Russian (5.3%, a difference of 0.080%), Ethiopian (5.3%, a difference of 0.080%), and Immigrants from Latvia (5.3%, a difference of 0.10%).
| Demographics | Rating | Rank | Disability Age 5 to 17 |
| Nicaraguans | 98.6 /100 | #102 | Exceptional 5.3% |
| Salvadorans | 98.6 /100 | #103 | Exceptional 5.3% |
| Peruvians | 98.5 /100 | #104 | Exceptional 5.3% |
| Immigrants | Italy | 98.4 /100 | #105 | Exceptional 5.3% |
| Immigrants | Yemen | 98.2 /100 | #106 | Exceptional 5.3% |
| Russians | 98.2 /100 | #107 | Exceptional 5.3% |
| Immigrants | South Africa | 98.1 /100 | #108 | Exceptional 5.3% |
| Immigrants | Northern Africa | 98.1 /100 | #109 | Exceptional 5.3% |
| Immigrants | Eritrea | 98.0 /100 | #110 | Exceptional 5.3% |
| Ethiopians | 97.9 /100 | #111 | Exceptional 5.3% |
| Immigrants | Latvia | 97.9 /100 | #112 | Exceptional 5.3% |
| Aleuts | 97.8 /100 | #113 | Exceptional 5.3% |
| Immigrants | Northern Europe | 97.8 /100 | #114 | Exceptional 5.3% |
| Cubans | 97.8 /100 | #115 | Exceptional 5.3% |
| Cypriots | 97.7 /100 | #116 | Exceptional 5.3% |
Demographics Similar to South Africans by Disability Age 5 to 17
In terms of disability age 5 to 17, the demographic groups most similar to South Africans are Immigrants from Zimbabwe (5.5%, a difference of 0.13%), Immigrants from Nepal (5.5%, a difference of 0.26%), Immigrants from Saudi Arabia (5.5%, a difference of 0.26%), Immigrants from Costa Rica (5.5%, a difference of 0.31%), and Hawaiian (5.5%, a difference of 0.32%).
| Demographics | Rating | Rank | Disability Age 5 to 17 |
| Ecuadorians | 79.7 /100 | #153 | Good 5.5% |
| Australians | 78.8 /100 | #154 | Good 5.5% |
| Immigrants | Ecuador | 78.3 /100 | #155 | Good 5.5% |
| Hawaiians | 78.0 /100 | #156 | Good 5.5% |
| Immigrants | Costa Rica | 77.9 /100 | #157 | Good 5.5% |
| Immigrants | Nepal | 77.1 /100 | #158 | Good 5.5% |
| Immigrants | Zimbabwe | 75.3 /100 | #159 | Good 5.5% |
| South Africans | 73.3 /100 | #160 | Good 5.5% |
| Immigrants | Saudi Arabia | 69.1 /100 | #161 | Good 5.5% |
| Zimbabweans | 67.2 /100 | #162 | Good 5.5% |
| Immigrants | Southern Europe | 64.0 /100 | #163 | Good 5.6% |
| Immigrants | Scotland | 61.9 /100 | #164 | Good 5.6% |
| Lebanese | 61.4 /100 | #165 | Good 5.6% |
| Greeks | 60.6 /100 | #166 | Good 5.6% |
| Immigrants | Burma/Myanmar | 59.3 /100 | #167 | Average 5.6% |