Immigrants from Nigeria vs Immigrants from Costa Rica Vision Disability
COMPARE
Immigrants from Nigeria
Immigrants from Costa Rica
Vision Disability
Vision Disability Comparison
Immigrants from Nigeria
Immigrants from Costa Rica
2.2%
VISION DISABILITY
13.5/ 100
METRIC RATING
207th/ 347
METRIC RANK
2.2%
VISION DISABILITY
26.1/ 100
METRIC RATING
190th/ 347
METRIC RANK
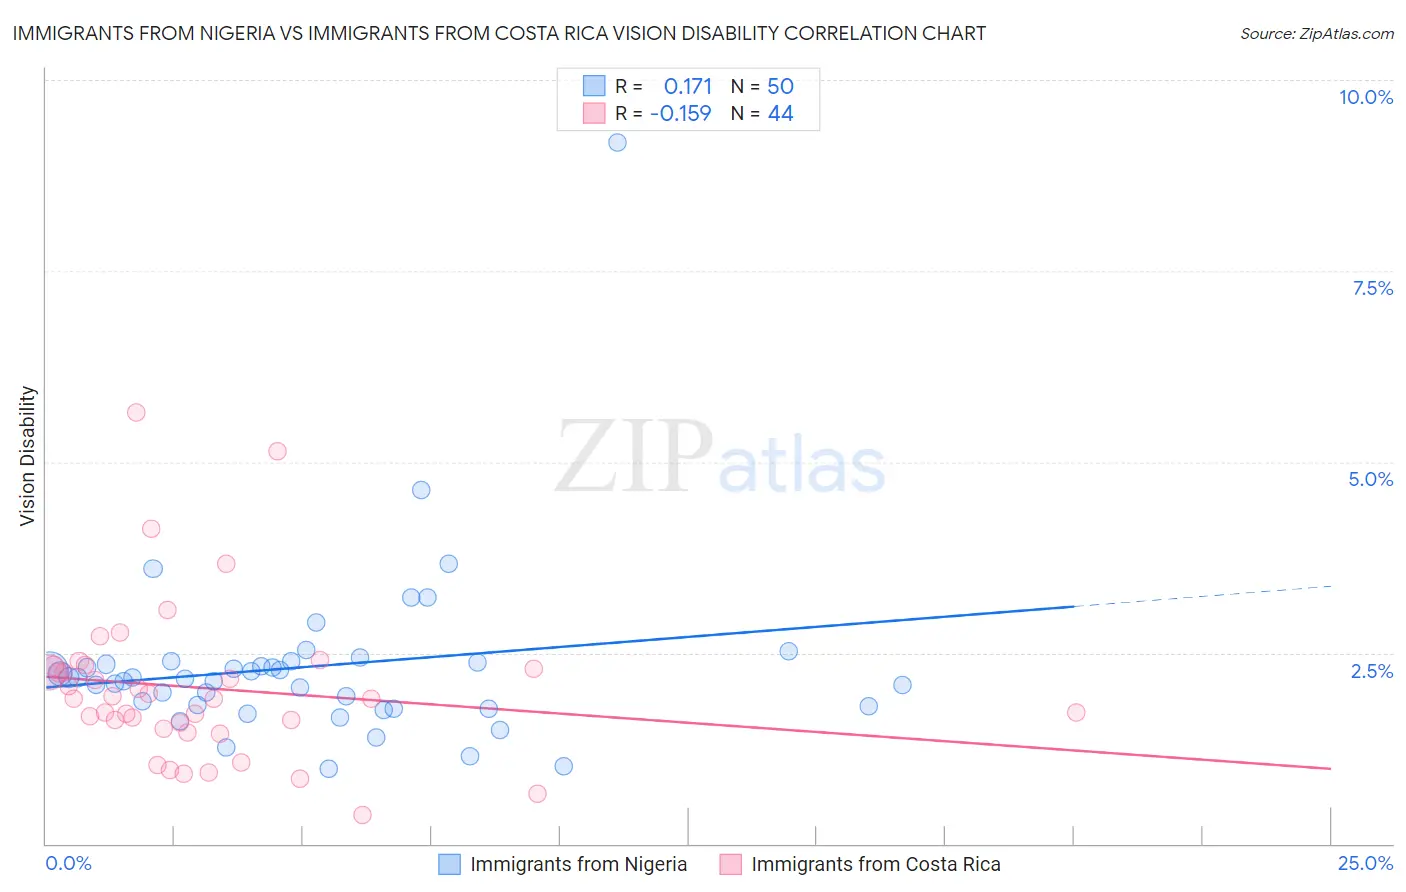
Immigrants from Nigeria vs Immigrants from Costa Rica Vision Disability Correlation Chart
The statistical analysis conducted on geographies consisting of 283,383,362 people shows a poor positive correlation between the proportion of Immigrants from Nigeria and percentage of population with vision disability in the United States with a correlation coefficient (R) of 0.171 and weighted average of 2.2%. Similarly, the statistical analysis conducted on geographies consisting of 204,228,483 people shows a poor negative correlation between the proportion of Immigrants from Costa Rica and percentage of population with vision disability in the United States with a correlation coefficient (R) of -0.159 and weighted average of 2.2%, a difference of 1.3%.
Vision Disability Correlation Summary
| Measurement | Immigrants from Nigeria | Immigrants from Costa Rica |
| Minimum | 0.98% | 0.38% |
| Maximum | 9.2% | 5.6% |
| Range | 8.2% | 5.3% |
| Mean | 2.3% | 2.0% |
| Median | 2.2% | 1.9% |
| Interquartile 25% (IQ1) | 1.8% | 1.5% |
| Interquartile 75% (IQ3) | 2.4% | 2.3% |
| Interquartile Range (IQR) | 0.58% | 0.75% |
| Standard Deviation (Sample) | 1.2% | 1.0% |
| Standard Deviation (Population) | 1.2% | 1.0% |
Demographics Similar to Immigrants from Nigeria and Immigrants from Costa Rica by Vision Disability
In terms of vision disability, the demographic groups most similar to Immigrants from Nigeria are German (2.2%, a difference of 0.010%), Pennsylvania German (2.2%, a difference of 0.13%), Samoan (2.2%, a difference of 0.27%), Immigrants from Guyana (2.2%, a difference of 0.30%), and Dutch (2.2%, a difference of 0.43%). Similarly, the demographic groups most similar to Immigrants from Costa Rica are Canadian (2.2%, a difference of 0.020%), European (2.2%, a difference of 0.030%), British (2.2%, a difference of 0.080%), Salvadoran (2.2%, a difference of 0.11%), and Immigrants from Barbados (2.2%, a difference of 0.17%).
| Demographics | Rating | Rank | Vision Disability |
| Guyanese | 28.9 /100 | #188 | Fair 2.2% |
| Salvadorans | 27.4 /100 | #189 | Fair 2.2% |
| Immigrants | Costa Rica | 26.1 /100 | #190 | Fair 2.2% |
| Canadians | 25.8 /100 | #191 | Fair 2.2% |
| Europeans | 25.7 /100 | #192 | Fair 2.2% |
| British | 25.1 /100 | #193 | Fair 2.2% |
| Immigrants | Barbados | 24.0 /100 | #194 | Fair 2.2% |
| Immigrants | Immigrants | 23.7 /100 | #195 | Fair 2.2% |
| Immigrants | Grenada | 23.1 /100 | #196 | Fair 2.2% |
| Ghanaians | 21.8 /100 | #197 | Fair 2.2% |
| Czechoslovakians | 21.6 /100 | #198 | Fair 2.2% |
| Immigrants | El Salvador | 21.0 /100 | #199 | Fair 2.2% |
| Immigrants | Thailand | 20.1 /100 | #200 | Fair 2.2% |
| Slovaks | 18.8 /100 | #201 | Poor 2.2% |
| Immigrants | Zaire | 18.0 /100 | #202 | Poor 2.2% |
| Dutch | 17.1 /100 | #203 | Poor 2.2% |
| Immigrants | Guyana | 15.9 /100 | #204 | Poor 2.2% |
| Samoans | 15.7 /100 | #205 | Poor 2.2% |
| Pennsylvania Germans | 14.5 /100 | #206 | Poor 2.2% |
| Immigrants | Nigeria | 13.5 /100 | #207 | Poor 2.2% |
| Germans | 13.4 /100 | #208 | Poor 2.2% |