Haitian vs Immigrants from Costa Rica Vision Disability
COMPARE
Haitian
Immigrants from Costa Rica
Vision Disability
Vision Disability Comparison
Haitians
Immigrants from Costa Rica
2.4%
VISION DISABILITY
0.3/ 100
METRIC RATING
254th/ 347
METRIC RANK
2.2%
VISION DISABILITY
26.1/ 100
METRIC RATING
190th/ 347
METRIC RANK
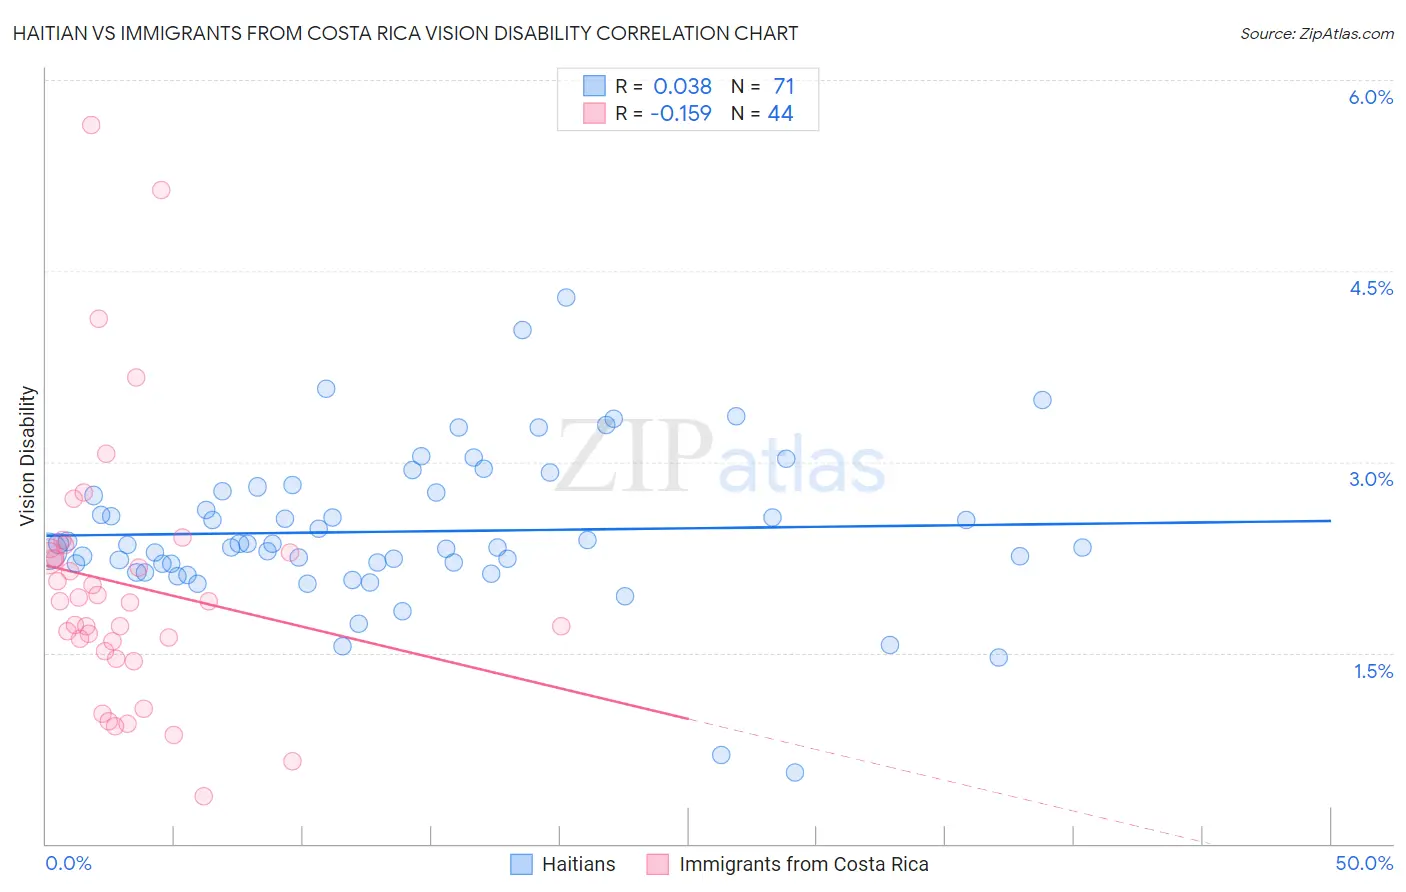
Haitian vs Immigrants from Costa Rica Vision Disability Correlation Chart
The statistical analysis conducted on geographies consisting of 287,754,917 people shows no correlation between the proportion of Haitians and percentage of population with vision disability in the United States with a correlation coefficient (R) of 0.038 and weighted average of 2.4%. Similarly, the statistical analysis conducted on geographies consisting of 204,228,483 people shows a poor negative correlation between the proportion of Immigrants from Costa Rica and percentage of population with vision disability in the United States with a correlation coefficient (R) of -0.159 and weighted average of 2.2%, a difference of 7.5%.
Vision Disability Correlation Summary
| Measurement | Haitian | Immigrants from Costa Rica |
| Minimum | 0.56% | 0.38% |
| Maximum | 4.3% | 5.6% |
| Range | 3.7% | 5.3% |
| Mean | 2.5% | 2.0% |
| Median | 2.3% | 1.9% |
| Interquartile 25% (IQ1) | 2.2% | 1.5% |
| Interquartile 75% (IQ3) | 2.8% | 2.3% |
| Interquartile Range (IQR) | 0.57% | 0.75% |
| Standard Deviation (Sample) | 0.62% | 1.0% |
| Standard Deviation (Population) | 0.61% | 1.0% |
Similar Demographics by Vision Disability
Demographics Similar to Haitians by Vision Disability
In terms of vision disability, the demographic groups most similar to Haitians are Immigrants from Guatemala (2.4%, a difference of 0.030%), Japanese (2.4%, a difference of 0.28%), Immigrants from Micronesia (2.4%, a difference of 0.35%), Immigrants from Haiti (2.4%, a difference of 0.36%), and West Indian (2.4%, a difference of 0.43%).
| Demographics | Rating | Rank | Vision Disability |
| Guatemalans | 0.5 /100 | #247 | Tragic 2.3% |
| Sub-Saharan Africans | 0.5 /100 | #248 | Tragic 2.3% |
| Liberians | 0.5 /100 | #249 | Tragic 2.3% |
| Bangladeshis | 0.5 /100 | #250 | Tragic 2.3% |
| Immigrants | Laos | 0.4 /100 | #251 | Tragic 2.4% |
| Immigrants | Micronesia | 0.3 /100 | #252 | Tragic 2.4% |
| Japanese | 0.3 /100 | #253 | Tragic 2.4% |
| Haitians | 0.3 /100 | #254 | Tragic 2.4% |
| Immigrants | Guatemala | 0.3 /100 | #255 | Tragic 2.4% |
| Immigrants | Haiti | 0.2 /100 | #256 | Tragic 2.4% |
| West Indians | 0.2 /100 | #257 | Tragic 2.4% |
| British West Indians | 0.2 /100 | #258 | Tragic 2.4% |
| Whites/Caucasians | 0.2 /100 | #259 | Tragic 2.4% |
| Belizeans | 0.2 /100 | #260 | Tragic 2.4% |
| Fijians | 0.1 /100 | #261 | Tragic 2.4% |
Demographics Similar to Immigrants from Costa Rica by Vision Disability
In terms of vision disability, the demographic groups most similar to Immigrants from Costa Rica are Canadian (2.2%, a difference of 0.020%), European (2.2%, a difference of 0.030%), British (2.2%, a difference of 0.080%), Salvadoran (2.2%, a difference of 0.11%), and Immigrants from Barbados (2.2%, a difference of 0.17%).
| Demographics | Rating | Rank | Vision Disability |
| Immigrants | Burma/Myanmar | 37.9 /100 | #183 | Fair 2.2% |
| Moroccans | 35.4 /100 | #184 | Fair 2.2% |
| Immigrants | Middle Africa | 33.5 /100 | #185 | Fair 2.2% |
| Native Hawaiians | 33.3 /100 | #186 | Fair 2.2% |
| Immigrants | St. Vincent and the Grenadines | 30.3 /100 | #187 | Fair 2.2% |
| Guyanese | 28.9 /100 | #188 | Fair 2.2% |
| Salvadorans | 27.4 /100 | #189 | Fair 2.2% |
| Immigrants | Costa Rica | 26.1 /100 | #190 | Fair 2.2% |
| Canadians | 25.8 /100 | #191 | Fair 2.2% |
| Europeans | 25.7 /100 | #192 | Fair 2.2% |
| British | 25.1 /100 | #193 | Fair 2.2% |
| Immigrants | Barbados | 24.0 /100 | #194 | Fair 2.2% |
| Immigrants | Immigrants | 23.7 /100 | #195 | Fair 2.2% |
| Immigrants | Grenada | 23.1 /100 | #196 | Fair 2.2% |
| Ghanaians | 21.8 /100 | #197 | Fair 2.2% |