Immigrants from Nigeria vs Immigrants from Costa Rica Unemployment Among Women with Children Ages 6 to 17 years
COMPARE
Immigrants from Nigeria
Immigrants from Costa Rica
Unemployment Among Women with Children Ages 6 to 17 years
Unemployment Among Women with Children Ages 6 to 17 years Comparison
Immigrants from Nigeria
Immigrants from Costa Rica
10.2%
UNEMPLOYMENT AMONG WOMEN WITH CHILDREN AGES 6 TO 17 YEARS
0.0/ 100
METRIC RATING
305th/ 347
METRIC RANK
9.0%
UNEMPLOYMENT AMONG WOMEN WITH CHILDREN AGES 6 TO 17 YEARS
50.0/ 100
METRIC RATING
174th/ 347
METRIC RANK
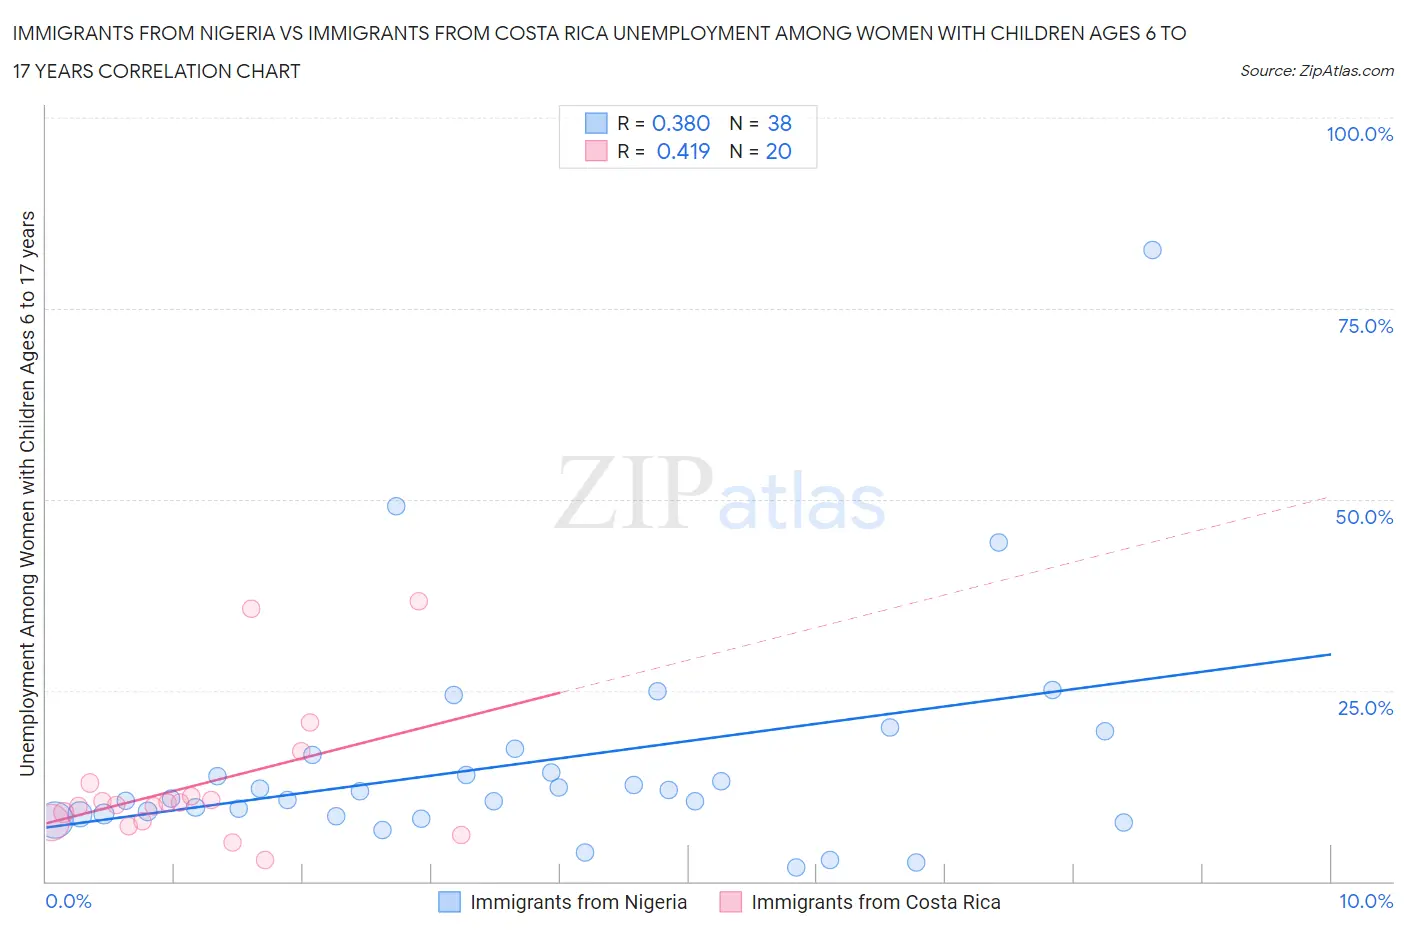
Immigrants from Nigeria vs Immigrants from Costa Rica Unemployment Among Women with Children Ages 6 to 17 years Correlation Chart
The statistical analysis conducted on geographies consisting of 224,793,064 people shows a mild positive correlation between the proportion of Immigrants from Nigeria and unemployment rate among women with children between the ages 6 and 17 in the United States with a correlation coefficient (R) of 0.380 and weighted average of 10.2%. Similarly, the statistical analysis conducted on geographies consisting of 165,891,261 people shows a moderate positive correlation between the proportion of Immigrants from Costa Rica and unemployment rate among women with children between the ages 6 and 17 in the United States with a correlation coefficient (R) of 0.419 and weighted average of 9.0%, a difference of 13.7%.
Unemployment Among Women with Children Ages 6 to 17 years Correlation Summary
| Measurement | Immigrants from Nigeria | Immigrants from Costa Rica |
| Minimum | 1.8% | 2.8% |
| Maximum | 82.6% | 36.7% |
| Range | 80.8% | 33.9% |
| Mean | 15.5% | 12.6% |
| Median | 11.3% | 10.1% |
| Interquartile 25% (IQ1) | 8.8% | 7.8% |
| Interquartile 75% (IQ3) | 16.5% | 12.0% |
| Interquartile Range (IQR) | 7.7% | 4.2% |
| Standard Deviation (Sample) | 14.8% | 9.0% |
| Standard Deviation (Population) | 14.6% | 8.7% |
Similar Demographics by Unemployment Among Women with Children Ages 6 to 17 years
Demographics Similar to Immigrants from Nigeria by Unemployment Among Women with Children Ages 6 to 17 years
In terms of unemployment among women with children ages 6 to 17 years, the demographic groups most similar to Immigrants from Nigeria are Immigrants from Venezuela (10.2%, a difference of 0.060%), Immigrants from Ecuador (10.2%, a difference of 0.15%), Paraguayan (10.2%, a difference of 0.29%), Venezuelan (10.2%, a difference of 0.32%), and Immigrants from Senegal (10.2%, a difference of 0.52%).
| Demographics | Rating | Rank | Unemployment Among Women with Children Ages 6 to 17 years |
| Immigrants | Haiti | 0.0 /100 | #298 | Tragic 10.1% |
| Immigrants | Honduras | 0.0 /100 | #299 | Tragic 10.1% |
| Nigerians | 0.0 /100 | #300 | Tragic 10.1% |
| Immigrants | Bahamas | 0.0 /100 | #301 | Tragic 10.1% |
| Venezuelans | 0.0 /100 | #302 | Tragic 10.2% |
| Immigrants | Ecuador | 0.0 /100 | #303 | Tragic 10.2% |
| Immigrants | Venezuela | 0.0 /100 | #304 | Tragic 10.2% |
| Immigrants | Nigeria | 0.0 /100 | #305 | Tragic 10.2% |
| Paraguayans | 0.0 /100 | #306 | Tragic 10.2% |
| Immigrants | Senegal | 0.0 /100 | #307 | Tragic 10.2% |
| Dutch West Indians | 0.0 /100 | #308 | Tragic 10.2% |
| French Canadians | 0.0 /100 | #309 | Tragic 10.3% |
| Alaska Natives | 0.0 /100 | #310 | Tragic 10.3% |
| Immigrants | Liberia | 0.0 /100 | #311 | Tragic 10.3% |
| Africans | 0.0 /100 | #312 | Tragic 10.4% |
Demographics Similar to Immigrants from Costa Rica by Unemployment Among Women with Children Ages 6 to 17 years
In terms of unemployment among women with children ages 6 to 17 years, the demographic groups most similar to Immigrants from Costa Rica are Immigrants from Brazil (9.0%, a difference of 0.050%), Jordanian (9.0%, a difference of 0.10%), Immigrants from West Indies (9.0%, a difference of 0.10%), Turkish (8.9%, a difference of 0.18%), and Immigrants from Sierra Leone (9.0%, a difference of 0.18%).
| Demographics | Rating | Rank | Unemployment Among Women with Children Ages 6 to 17 years |
| Immigrants | England | 57.7 /100 | #167 | Average 8.9% |
| Immigrants | Croatia | 57.1 /100 | #168 | Average 8.9% |
| British | 55.2 /100 | #169 | Average 8.9% |
| Turks | 54.1 /100 | #170 | Average 8.9% |
| Jordanians | 52.2 /100 | #171 | Average 9.0% |
| Immigrants | West Indies | 52.2 /100 | #172 | Average 9.0% |
| Immigrants | Brazil | 51.0 /100 | #173 | Average 9.0% |
| Immigrants | Costa Rica | 50.0 /100 | #174 | Average 9.0% |
| Immigrants | Sierra Leone | 45.9 /100 | #175 | Average 9.0% |
| Immigrants | Italy | 43.7 /100 | #176 | Average 9.0% |
| Immigrants | Jordan | 41.6 /100 | #177 | Average 9.0% |
| Menominee | 39.3 /100 | #178 | Fair 9.0% |
| Immigrants | Zaire | 38.3 /100 | #179 | Fair 9.0% |
| Ethiopians | 37.6 /100 | #180 | Fair 9.0% |
| Immigrants | Czechoslovakia | 34.5 /100 | #181 | Fair 9.0% |