Immigrants from Nigeria vs Spanish American Vision Disability
COMPARE
Immigrants from Nigeria
Spanish American
Vision Disability
Vision Disability Comparison
Immigrants from Nigeria
Spanish Americans
2.2%
VISION DISABILITY
13.5/ 100
METRIC RATING
207th/ 347
METRIC RANK
2.9%
VISION DISABILITY
0.0/ 100
METRIC RATING
326th/ 347
METRIC RANK
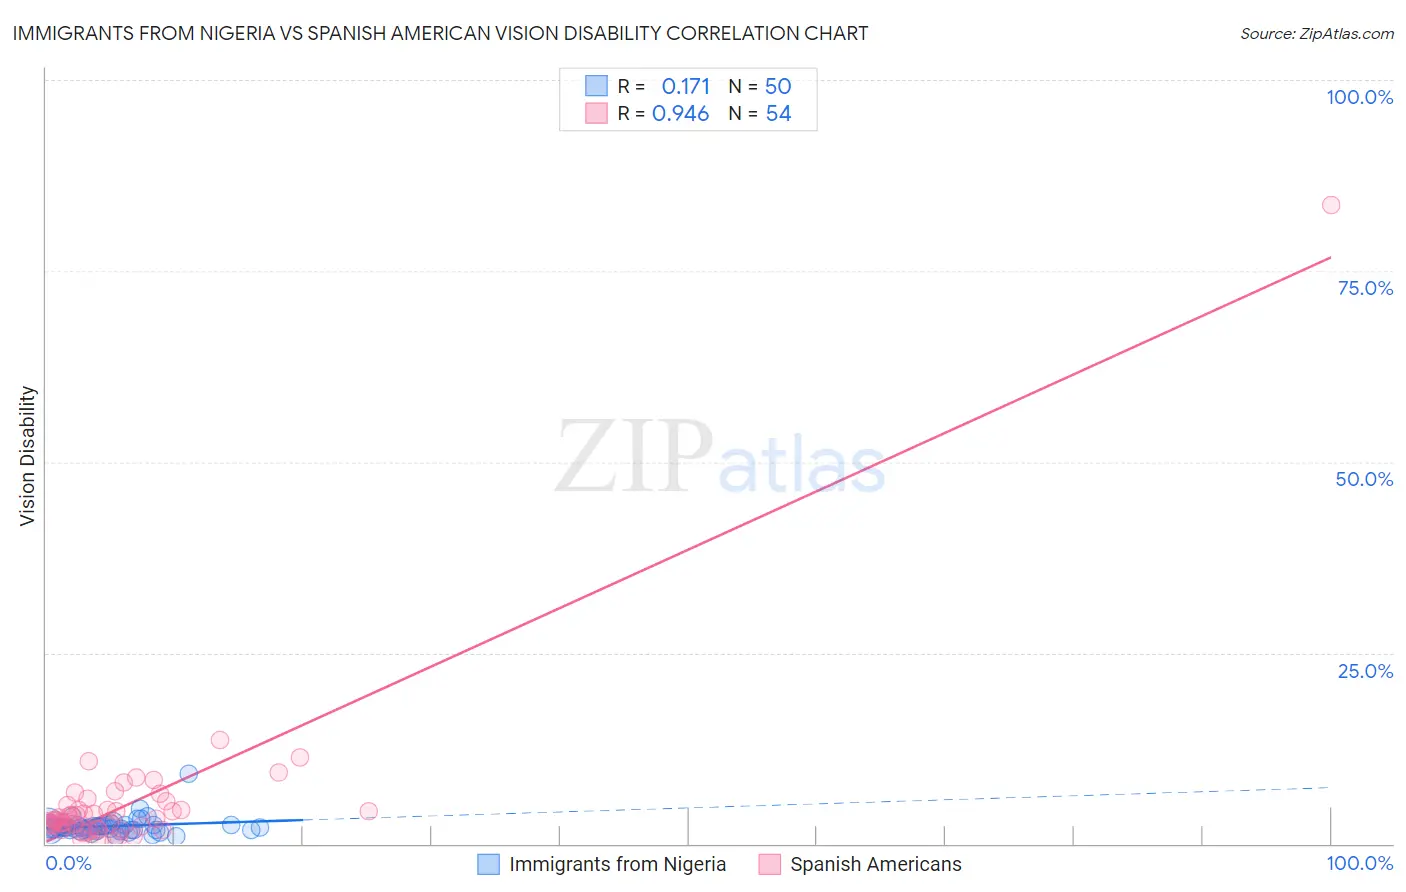
Immigrants from Nigeria vs Spanish American Vision Disability Correlation Chart
The statistical analysis conducted on geographies consisting of 283,383,362 people shows a poor positive correlation between the proportion of Immigrants from Nigeria and percentage of population with vision disability in the United States with a correlation coefficient (R) of 0.171 and weighted average of 2.2%. Similarly, the statistical analysis conducted on geographies consisting of 103,153,251 people shows a near-perfect positive correlation between the proportion of Spanish Americans and percentage of population with vision disability in the United States with a correlation coefficient (R) of 0.946 and weighted average of 2.9%, a difference of 32.1%.
Vision Disability Correlation Summary
| Measurement | Immigrants from Nigeria | Spanish American |
| Minimum | 0.98% | 0.38% |
| Maximum | 9.2% | 83.6% |
| Range | 8.2% | 83.3% |
| Mean | 2.3% | 5.5% |
| Median | 2.2% | 3.3% |
| Interquartile 25% (IQ1) | 1.8% | 2.3% |
| Interquartile 75% (IQ3) | 2.4% | 5.0% |
| Interquartile Range (IQR) | 0.58% | 2.7% |
| Standard Deviation (Sample) | 1.2% | 11.2% |
| Standard Deviation (Population) | 1.2% | 11.1% |
Similar Demographics by Vision Disability
Demographics Similar to Immigrants from Nigeria by Vision Disability
In terms of vision disability, the demographic groups most similar to Immigrants from Nigeria are German (2.2%, a difference of 0.010%), Immigrants from Brazil (2.2%, a difference of 0.040%), Pennsylvania German (2.2%, a difference of 0.13%), Samoan (2.2%, a difference of 0.27%), and Immigrants from Uruguay (2.2%, a difference of 0.27%).
| Demographics | Rating | Rank | Vision Disability |
| Immigrants | Thailand | 20.1 /100 | #200 | Fair 2.2% |
| Slovaks | 18.8 /100 | #201 | Poor 2.2% |
| Immigrants | Zaire | 18.0 /100 | #202 | Poor 2.2% |
| Dutch | 17.1 /100 | #203 | Poor 2.2% |
| Immigrants | Guyana | 15.9 /100 | #204 | Poor 2.2% |
| Samoans | 15.7 /100 | #205 | Poor 2.2% |
| Pennsylvania Germans | 14.5 /100 | #206 | Poor 2.2% |
| Immigrants | Nigeria | 13.5 /100 | #207 | Poor 2.2% |
| Germans | 13.4 /100 | #208 | Poor 2.2% |
| Immigrants | Brazil | 13.1 /100 | #209 | Poor 2.2% |
| Immigrants | Uruguay | 11.5 /100 | #210 | Poor 2.2% |
| Indonesians | 9.5 /100 | #211 | Tragic 2.2% |
| Bermudans | 9.0 /100 | #212 | Tragic 2.2% |
| Immigrants | Ghana | 8.9 /100 | #213 | Tragic 2.2% |
| Trinidadians and Tobagonians | 8.2 /100 | #214 | Tragic 2.2% |
Demographics Similar to Spanish Americans by Vision Disability
In terms of vision disability, the demographic groups most similar to Spanish Americans are Native/Alaskan (3.0%, a difference of 0.80%), Cherokee (2.9%, a difference of 1.2%), Hopi (2.9%, a difference of 1.2%), Yuman (3.0%, a difference of 1.3%), and Apache (3.0%, a difference of 1.5%).
| Demographics | Rating | Rank | Vision Disability |
| Tohono O'odham | 0.0 /100 | #319 | Tragic 2.8% |
| Blacks/African Americans | 0.0 /100 | #320 | Tragic 2.8% |
| Comanche | 0.0 /100 | #321 | Tragic 2.8% |
| Paiute | 0.0 /100 | #322 | Tragic 2.9% |
| Tlingit-Haida | 0.0 /100 | #323 | Tragic 2.9% |
| Hopi | 0.0 /100 | #324 | Tragic 2.9% |
| Cherokee | 0.0 /100 | #325 | Tragic 2.9% |
| Spanish Americans | 0.0 /100 | #326 | Tragic 2.9% |
| Natives/Alaskans | 0.0 /100 | #327 | Tragic 3.0% |
| Yuman | 0.0 /100 | #328 | Tragic 3.0% |
| Apache | 0.0 /100 | #329 | Tragic 3.0% |
| Colville | 0.0 /100 | #330 | Tragic 3.0% |
| Central American Indians | 0.0 /100 | #331 | Tragic 3.0% |
| Seminole | 0.0 /100 | #332 | Tragic 3.1% |
| Cajuns | 0.0 /100 | #333 | Tragic 3.1% |