Immigrants from Nigeria vs Immigrants from St. Vincent and the Grenadines Vision Disability
COMPARE
Immigrants from Nigeria
Immigrants from St. Vincent and the Grenadines
Vision Disability
Vision Disability Comparison
Immigrants from Nigeria
Immigrants from St. Vincent and the Grenadines
2.2%
VISION DISABILITY
13.5/ 100
METRIC RATING
207th/ 347
METRIC RANK
2.2%
VISION DISABILITY
30.3/ 100
METRIC RATING
187th/ 347
METRIC RANK
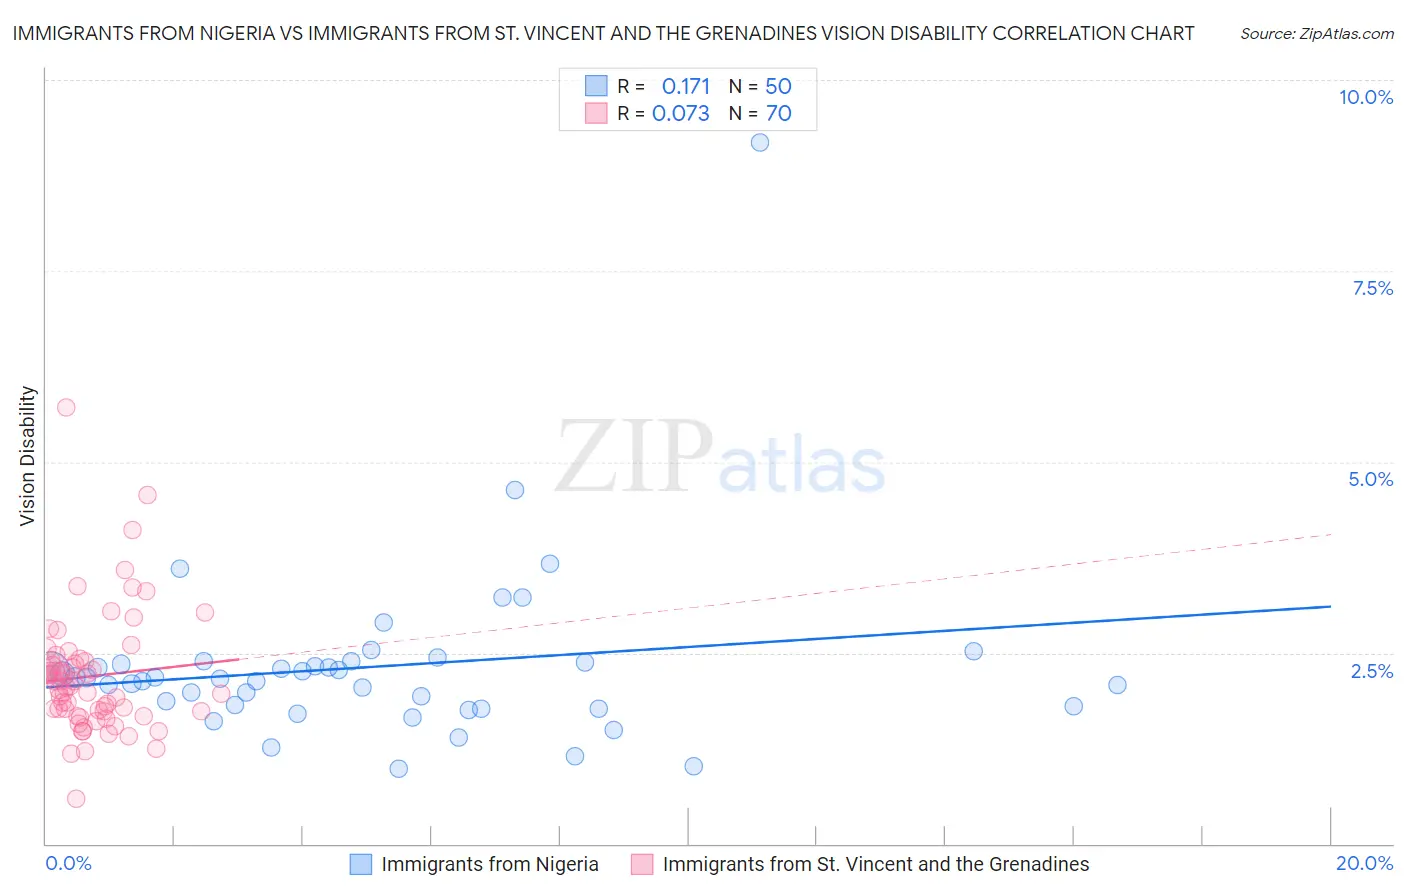
Immigrants from Nigeria vs Immigrants from St. Vincent and the Grenadines Vision Disability Correlation Chart
The statistical analysis conducted on geographies consisting of 283,383,362 people shows a poor positive correlation between the proportion of Immigrants from Nigeria and percentage of population with vision disability in the United States with a correlation coefficient (R) of 0.171 and weighted average of 2.2%. Similarly, the statistical analysis conducted on geographies consisting of 56,186,719 people shows a slight positive correlation between the proportion of Immigrants from St. Vincent and the Grenadines and percentage of population with vision disability in the United States with a correlation coefficient (R) of 0.073 and weighted average of 2.2%, a difference of 1.6%.
Vision Disability Correlation Summary
| Measurement | Immigrants from Nigeria | Immigrants from St. Vincent and the Grenadines |
| Minimum | 0.98% | 0.59% |
| Maximum | 9.2% | 5.7% |
| Range | 8.2% | 5.1% |
| Mean | 2.3% | 2.2% |
| Median | 2.2% | 2.1% |
| Interquartile 25% (IQ1) | 1.8% | 1.7% |
| Interquartile 75% (IQ3) | 2.4% | 2.4% |
| Interquartile Range (IQR) | 0.58% | 0.67% |
| Standard Deviation (Sample) | 1.2% | 0.80% |
| Standard Deviation (Population) | 1.2% | 0.79% |
Demographics Similar to Immigrants from Nigeria and Immigrants from St. Vincent and the Grenadines by Vision Disability
In terms of vision disability, the demographic groups most similar to Immigrants from Nigeria are Pennsylvania German (2.2%, a difference of 0.13%), Samoan (2.2%, a difference of 0.27%), Immigrants from Guyana (2.2%, a difference of 0.30%), Dutch (2.2%, a difference of 0.43%), and Immigrants from Zaire (2.2%, a difference of 0.53%). Similarly, the demographic groups most similar to Immigrants from St. Vincent and the Grenadines are Guyanese (2.2%, a difference of 0.11%), Salvadoran (2.2%, a difference of 0.21%), Immigrants from Costa Rica (2.2%, a difference of 0.32%), Canadian (2.2%, a difference of 0.34%), and European (2.2%, a difference of 0.35%).
| Demographics | Rating | Rank | Vision Disability |
| Immigrants | St. Vincent and the Grenadines | 30.3 /100 | #187 | Fair 2.2% |
| Guyanese | 28.9 /100 | #188 | Fair 2.2% |
| Salvadorans | 27.4 /100 | #189 | Fair 2.2% |
| Immigrants | Costa Rica | 26.1 /100 | #190 | Fair 2.2% |
| Canadians | 25.8 /100 | #191 | Fair 2.2% |
| Europeans | 25.7 /100 | #192 | Fair 2.2% |
| British | 25.1 /100 | #193 | Fair 2.2% |
| Immigrants | Barbados | 24.0 /100 | #194 | Fair 2.2% |
| Immigrants | Immigrants | 23.7 /100 | #195 | Fair 2.2% |
| Immigrants | Grenada | 23.1 /100 | #196 | Fair 2.2% |
| Ghanaians | 21.8 /100 | #197 | Fair 2.2% |
| Czechoslovakians | 21.6 /100 | #198 | Fair 2.2% |
| Immigrants | El Salvador | 21.0 /100 | #199 | Fair 2.2% |
| Immigrants | Thailand | 20.1 /100 | #200 | Fair 2.2% |
| Slovaks | 18.8 /100 | #201 | Poor 2.2% |
| Immigrants | Zaire | 18.0 /100 | #202 | Poor 2.2% |
| Dutch | 17.1 /100 | #203 | Poor 2.2% |
| Immigrants | Guyana | 15.9 /100 | #204 | Poor 2.2% |
| Samoans | 15.7 /100 | #205 | Poor 2.2% |
| Pennsylvania Germans | 14.5 /100 | #206 | Poor 2.2% |
| Immigrants | Nigeria | 13.5 /100 | #207 | Poor 2.2% |