Immigrants from Netherlands vs Kiowa In Labor Force | Age 16-19
COMPARE
Immigrants from Netherlands
Kiowa
In Labor Force | Age 16-19
In Labor Force | Age 16-19 Comparison
Immigrants from Netherlands
Kiowa
37.8%
IN LABOR FORCE | AGE 16-19
93.7/ 100
METRIC RATING
134th/ 347
METRIC RANK
37.2%
IN LABOR FORCE | AGE 16-19
80.4/ 100
METRIC RATING
156th/ 347
METRIC RANK
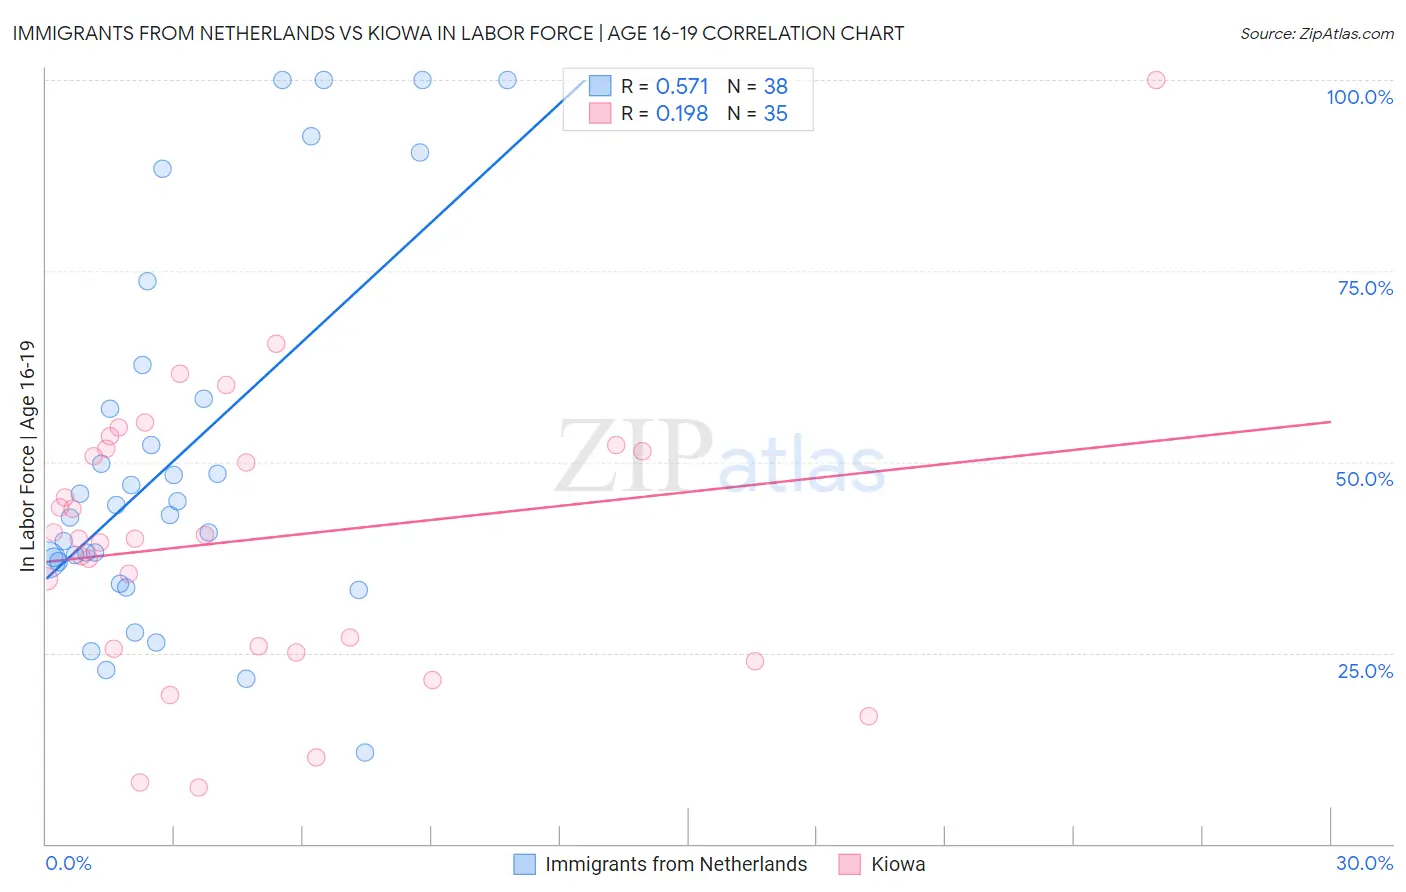
Immigrants from Netherlands vs Kiowa In Labor Force | Age 16-19 Correlation Chart
The statistical analysis conducted on geographies consisting of 237,512,378 people shows a substantial positive correlation between the proportion of Immigrants from Netherlands and labor force participation rate among population between the ages 16 and 19 in the United States with a correlation coefficient (R) of 0.571 and weighted average of 37.8%. Similarly, the statistical analysis conducted on geographies consisting of 56,077,832 people shows a poor positive correlation between the proportion of Kiowa and labor force participation rate among population between the ages 16 and 19 in the United States with a correlation coefficient (R) of 0.198 and weighted average of 37.2%, a difference of 1.6%.
In Labor Force | Age 16-19 Correlation Summary
| Measurement | Immigrants from Netherlands | Kiowa |
| Minimum | 12.0% | 7.4% |
| Maximum | 100.0% | 100.0% |
| Range | 88.0% | 92.6% |
| Mean | 50.8% | 39.9% |
| Median | 43.7% | 40.0% |
| Interquartile 25% (IQ1) | 36.9% | 25.5% |
| Interquartile 75% (IQ3) | 58.3% | 51.7% |
| Interquartile Range (IQR) | 21.4% | 26.2% |
| Standard Deviation (Sample) | 24.7% | 18.6% |
| Standard Deviation (Population) | 24.3% | 18.3% |
Similar Demographics by In Labor Force | Age 16-19
Demographics Similar to Immigrants from Netherlands by In Labor Force | Age 16-19
In terms of in labor force | age 16-19, the demographic groups most similar to Immigrants from Netherlands are Macedonian (37.8%, a difference of 0.060%), Australian (37.8%, a difference of 0.090%), Cajun (37.8%, a difference of 0.090%), Cheyenne (37.9%, a difference of 0.21%), and Immigrants from Oceania (37.9%, a difference of 0.23%).
| Demographics | Rating | Rank | In Labor Force | Age 16-19 |
| Choctaw | 95.6 /100 | #127 | Exceptional 38.0% |
| New Zealanders | 95.6 /100 | #128 | Exceptional 38.0% |
| Spaniards | 95.5 /100 | #129 | Exceptional 38.0% |
| Immigrants | Zimbabwe | 95.4 /100 | #130 | Exceptional 38.0% |
| Immigrants | Austria | 95.0 /100 | #131 | Exceptional 37.9% |
| Immigrants | Oceania | 94.7 /100 | #132 | Exceptional 37.9% |
| Cheyenne | 94.6 /100 | #133 | Exceptional 37.9% |
| Immigrants | Netherlands | 93.7 /100 | #134 | Exceptional 37.8% |
| Macedonians | 93.4 /100 | #135 | Exceptional 37.8% |
| Australians | 93.2 /100 | #136 | Exceptional 37.8% |
| Cajuns | 93.2 /100 | #137 | Exceptional 37.8% |
| Comanche | 91.9 /100 | #138 | Exceptional 37.7% |
| Immigrants | Moldova | 91.9 /100 | #139 | Exceptional 37.7% |
| Estonians | 91.7 /100 | #140 | Exceptional 37.7% |
| Syrians | 90.7 /100 | #141 | Exceptional 37.6% |
Demographics Similar to Kiowa by In Labor Force | Age 16-19
In terms of in labor force | age 16-19, the demographic groups most similar to Kiowa are Immigrants from Lithuania (37.2%, a difference of 0.020%), Immigrants from Bulgaria (37.3%, a difference of 0.10%), Arapaho (37.3%, a difference of 0.12%), Immigrants from Sierra Leone (37.3%, a difference of 0.27%), and Immigrants from Brazil (37.1%, a difference of 0.29%).
| Demographics | Rating | Rank | In Labor Force | Age 16-19 |
| Native Hawaiians | 85.0 /100 | #149 | Excellent 37.4% |
| Tsimshian | 84.7 /100 | #150 | Excellent 37.4% |
| Immigrants | Poland | 84.4 /100 | #151 | Excellent 37.3% |
| Immigrants | Sierra Leone | 83.6 /100 | #152 | Excellent 37.3% |
| Arapaho | 81.8 /100 | #153 | Excellent 37.3% |
| Immigrants | Bulgaria | 81.6 /100 | #154 | Excellent 37.3% |
| Immigrants | Lithuania | 80.7 /100 | #155 | Excellent 37.2% |
| Kiowa | 80.4 /100 | #156 | Excellent 37.2% |
| Immigrants | Brazil | 76.5 /100 | #157 | Good 37.1% |
| Ute | 75.7 /100 | #158 | Good 37.1% |
| Yaqui | 74.4 /100 | #159 | Good 37.1% |
| Immigrants | Saudi Arabia | 73.9 /100 | #160 | Good 37.0% |
| Cambodians | 71.5 /100 | #161 | Good 37.0% |
| Immigrants | Jordan | 69.5 /100 | #162 | Good 36.9% |
| Bermudans | 69.3 /100 | #163 | Good 36.9% |