Immigrants from Netherlands vs Haitian Male Disability
COMPARE
Immigrants from Netherlands
Haitian
Male Disability
Male Disability Comparison
Immigrants from Netherlands
Haitians
11.4%
MALE DISABILITY
25.9/ 100
METRIC RATING
189th/ 347
METRIC RANK
11.2%
MALE DISABILITY
52.5/ 100
METRIC RATING
171st/ 347
METRIC RANK
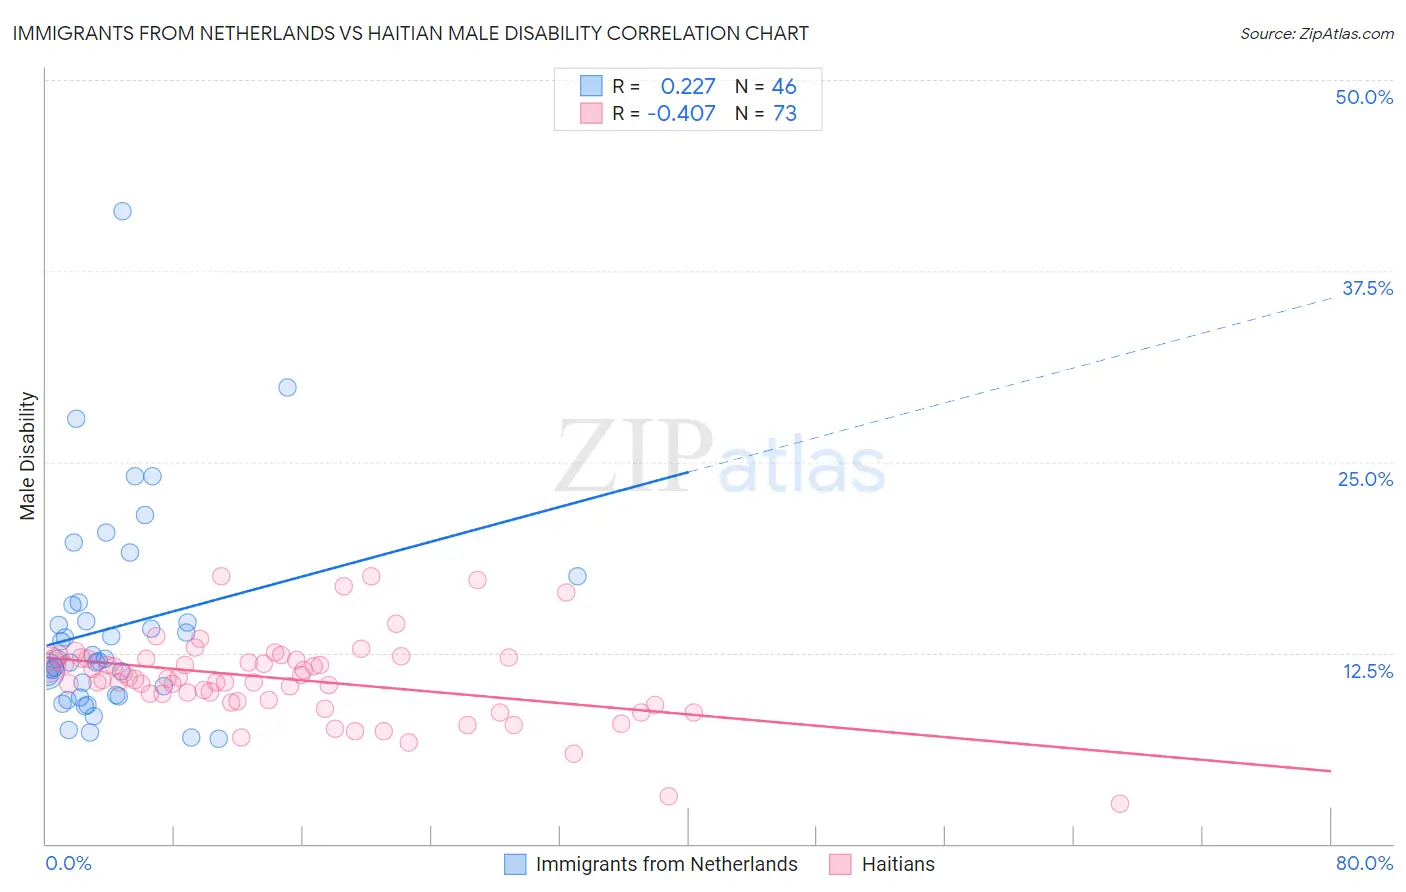
Immigrants from Netherlands vs Haitian Male Disability Correlation Chart
The statistical analysis conducted on geographies consisting of 237,879,390 people shows a weak positive correlation between the proportion of Immigrants from Netherlands and percentage of males with a disability in the United States with a correlation coefficient (R) of 0.227 and weighted average of 11.4%. Similarly, the statistical analysis conducted on geographies consisting of 287,906,859 people shows a moderate negative correlation between the proportion of Haitians and percentage of males with a disability in the United States with a correlation coefficient (R) of -0.407 and weighted average of 11.2%, a difference of 1.6%.
Male Disability Correlation Summary
| Measurement | Immigrants from Netherlands | Haitian |
| Minimum | 6.9% | 2.6% |
| Maximum | 41.4% | 17.5% |
| Range | 34.5% | 14.9% |
| Mean | 14.2% | 10.8% |
| Median | 12.0% | 10.8% |
| Interquartile 25% (IQ1) | 9.8% | 9.4% |
| Interquartile 75% (IQ3) | 15.6% | 12.1% |
| Interquartile Range (IQR) | 5.8% | 2.7% |
| Standard Deviation (Sample) | 6.7% | 2.8% |
| Standard Deviation (Population) | 6.6% | 2.7% |
Demographics Similar to Immigrants from Netherlands and Haitians by Male Disability
In terms of male disability, the demographic groups most similar to Immigrants from Netherlands are Immigrants from Bosnia and Herzegovina (11.4%, a difference of 0.040%), Estonian (11.4%, a difference of 0.060%), Immigrants from Austria (11.4%, a difference of 0.10%), Immigrants from Zaire (11.4%, a difference of 0.12%), and Pakistani (11.3%, a difference of 0.30%). Similarly, the demographic groups most similar to Haitians are New Zealander (11.2%, a difference of 0.020%), Romanian (11.2%, a difference of 0.10%), Immigrants from Burma/Myanmar (11.2%, a difference of 0.12%), Maltese (11.2%, a difference of 0.14%), and Immigrants from Honduras (11.2%, a difference of 0.21%).
| Demographics | Rating | Rank | Male Disability |
| New Zealanders | 52.9 /100 | #170 | Average 11.2% |
| Haitians | 52.5 /100 | #171 | Average 11.2% |
| Romanians | 50.7 /100 | #172 | Average 11.2% |
| Immigrants | Burma/Myanmar | 50.4 /100 | #173 | Average 11.2% |
| Maltese | 50.0 /100 | #174 | Average 11.2% |
| Immigrants | Honduras | 48.7 /100 | #175 | Average 11.2% |
| Syrians | 46.6 /100 | #176 | Average 11.2% |
| Immigrants | Norway | 44.2 /100 | #177 | Average 11.3% |
| Australians | 42.2 /100 | #178 | Average 11.3% |
| Immigrants | Caribbean | 41.4 /100 | #179 | Average 11.3% |
| Hondurans | 41.1 /100 | #180 | Average 11.3% |
| Immigrants | Senegal | 34.4 /100 | #181 | Fair 11.3% |
| Immigrants | Belize | 33.7 /100 | #182 | Fair 11.3% |
| Immigrants | Central America | 32.9 /100 | #183 | Fair 11.3% |
| Iraqis | 30.5 /100 | #184 | Fair 11.3% |
| Pakistanis | 30.3 /100 | #185 | Fair 11.3% |
| Immigrants | Zaire | 27.6 /100 | #186 | Fair 11.4% |
| Immigrants | Austria | 27.3 /100 | #187 | Fair 11.4% |
| Estonians | 26.8 /100 | #188 | Fair 11.4% |
| Immigrants | Netherlands | 25.9 /100 | #189 | Fair 11.4% |
| Immigrants | Bosnia and Herzegovina | 25.4 /100 | #190 | Fair 11.4% |