Immigrants from Moldova vs Tohono O'odham Male Disability
COMPARE
Immigrants from Moldova
Tohono O'odham
Male Disability
Male Disability Comparison
Immigrants from Moldova
Tohono O'odham
11.1%
MALE DISABILITY
72.8/ 100
METRIC RATING
154th/ 347
METRIC RANK
14.6%
MALE DISABILITY
0.0/ 100
METRIC RATING
331st/ 347
METRIC RANK
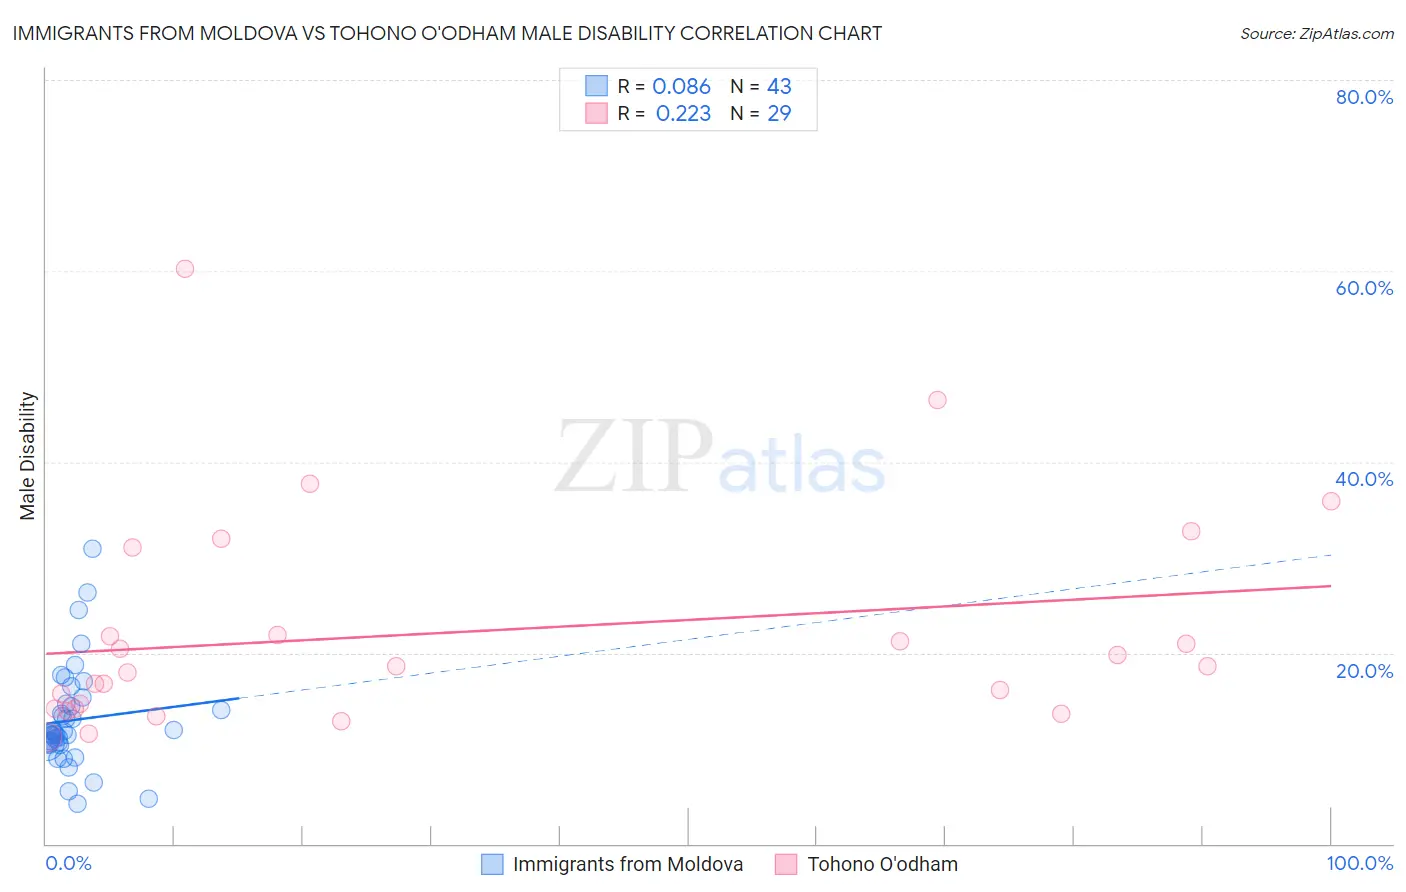
Immigrants from Moldova vs Tohono O'odham Male Disability Correlation Chart
The statistical analysis conducted on geographies consisting of 124,384,403 people shows a slight positive correlation between the proportion of Immigrants from Moldova and percentage of males with a disability in the United States with a correlation coefficient (R) of 0.086 and weighted average of 11.1%. Similarly, the statistical analysis conducted on geographies consisting of 58,720,807 people shows a weak positive correlation between the proportion of Tohono O'odham and percentage of males with a disability in the United States with a correlation coefficient (R) of 0.223 and weighted average of 14.6%, a difference of 32.1%.
Male Disability Correlation Summary
| Measurement | Immigrants from Moldova | Tohono O'odham |
| Minimum | 4.1% | 11.2% |
| Maximum | 31.0% | 60.2% |
| Range | 26.8% | 49.0% |
| Mean | 13.0% | 22.1% |
| Median | 11.5% | 18.6% |
| Interquartile 25% (IQ1) | 10.5% | 14.1% |
| Interquartile 75% (IQ3) | 14.6% | 26.4% |
| Interquartile Range (IQR) | 4.1% | 12.3% |
| Standard Deviation (Sample) | 5.3% | 11.4% |
| Standard Deviation (Population) | 5.3% | 11.2% |
Similar Demographics by Male Disability
Demographics Similar to Immigrants from Moldova by Male Disability
In terms of male disability, the demographic groups most similar to Immigrants from Moldova are Immigrants from Northern Europe (11.1%, a difference of 0.020%), Immigrants from Albania (11.0%, a difference of 0.11%), Immigrants from Middle Africa (11.1%, a difference of 0.14%), Cuban (11.0%, a difference of 0.15%), and Immigrants from Guatemala (11.0%, a difference of 0.17%).
| Demographics | Rating | Rank | Male Disability |
| Immigrants | Croatia | 77.3 /100 | #147 | Good 11.0% |
| Sudanese | 77.1 /100 | #148 | Good 11.0% |
| Immigrants | Denmark | 76.4 /100 | #149 | Good 11.0% |
| Immigrants | Guatemala | 75.1 /100 | #150 | Good 11.0% |
| Cubans | 74.9 /100 | #151 | Good 11.0% |
| Immigrants | Albania | 74.4 /100 | #152 | Good 11.0% |
| Immigrants | Northern Europe | 73.2 /100 | #153 | Good 11.1% |
| Immigrants | Moldova | 72.8 /100 | #154 | Good 11.1% |
| Immigrants | Middle Africa | 70.9 /100 | #155 | Good 11.1% |
| Russians | 69.8 /100 | #156 | Good 11.1% |
| Immigrants | Western Africa | 69.2 /100 | #157 | Good 11.1% |
| Latvians | 68.1 /100 | #158 | Good 11.1% |
| Guatemalans | 67.2 /100 | #159 | Good 11.1% |
| Albanians | 66.5 /100 | #160 | Good 11.1% |
| Immigrants | West Indies | 65.7 /100 | #161 | Good 11.1% |
Demographics Similar to Tohono O'odham by Male Disability
In terms of male disability, the demographic groups most similar to Tohono O'odham are Seminole (14.7%, a difference of 0.78%), Yuman (14.7%, a difference of 0.87%), Navajo (14.4%, a difference of 1.5%), Cherokee (14.8%, a difference of 1.6%), and Dutch West Indian (14.8%, a difference of 1.6%).
| Demographics | Rating | Rank | Male Disability |
| Comanche | 0.0 /100 | #324 | Tragic 14.1% |
| Ottawa | 0.0 /100 | #325 | Tragic 14.1% |
| Natives/Alaskans | 0.0 /100 | #326 | Tragic 14.2% |
| Potawatomi | 0.0 /100 | #327 | Tragic 14.2% |
| Chippewa | 0.0 /100 | #328 | Tragic 14.3% |
| Cajuns | 0.0 /100 | #329 | Tragic 14.4% |
| Navajo | 0.0 /100 | #330 | Tragic 14.4% |
| Tohono O'odham | 0.0 /100 | #331 | Tragic 14.6% |
| Seminole | 0.0 /100 | #332 | Tragic 14.7% |
| Yuman | 0.0 /100 | #333 | Tragic 14.7% |
| Cherokee | 0.0 /100 | #334 | Tragic 14.8% |
| Dutch West Indians | 0.0 /100 | #335 | Tragic 14.8% |
| Alaskan Athabascans | 0.0 /100 | #336 | Tragic 14.9% |
| Menominee | 0.0 /100 | #337 | Tragic 15.0% |
| Pueblo | 0.0 /100 | #338 | Tragic 15.0% |