French Canadian vs Immigrants from Western Europe Female Disability
COMPARE
French Canadian
Immigrants from Western Europe
Female Disability
Female Disability Comparison
French Canadians
Immigrants from Western Europe
13.6%
FEMALE DISABILITY
0.0/ 100
METRIC RATING
306th/ 347
METRIC RANK
12.2%
FEMALE DISABILITY
40.9/ 100
METRIC RATING
178th/ 347
METRIC RANK
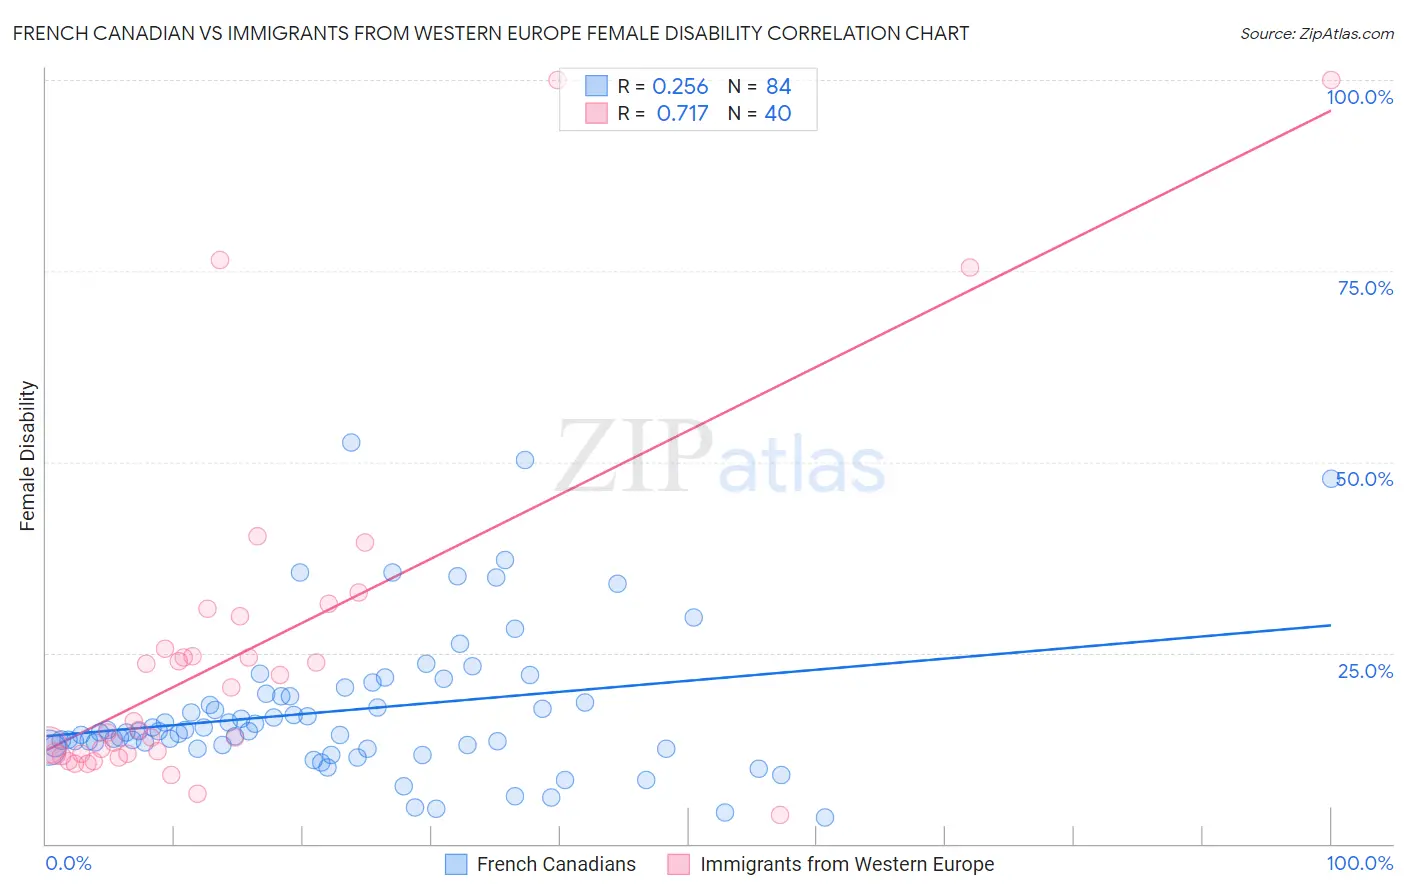
French Canadian vs Immigrants from Western Europe Female Disability Correlation Chart
The statistical analysis conducted on geographies consisting of 502,526,551 people shows a weak positive correlation between the proportion of French Canadians and percentage of females with a disability in the United States with a correlation coefficient (R) of 0.256 and weighted average of 13.6%. Similarly, the statistical analysis conducted on geographies consisting of 494,007,860 people shows a strong positive correlation between the proportion of Immigrants from Western Europe and percentage of females with a disability in the United States with a correlation coefficient (R) of 0.717 and weighted average of 12.2%, a difference of 11.0%.
Female Disability Correlation Summary
| Measurement | French Canadian | Immigrants from Western Europe |
| Minimum | 3.4% | 3.8% |
| Maximum | 52.5% | 100.0% |
| Range | 49.1% | 96.2% |
| Mean | 17.5% | 25.3% |
| Median | 14.7% | 15.5% |
| Interquartile 25% (IQ1) | 12.7% | 11.8% |
| Interquartile 75% (IQ3) | 19.5% | 27.7% |
| Interquartile Range (IQR) | 6.8% | 15.9% |
| Standard Deviation (Sample) | 9.7% | 23.2% |
| Standard Deviation (Population) | 9.6% | 22.9% |
Similar Demographics by Female Disability
Demographics Similar to French Canadians by Female Disability
In terms of female disability, the demographic groups most similar to French Canadians are Central American Indian (13.6%, a difference of 0.29%), Dominican (13.5%, a difference of 0.63%), Cree (13.7%, a difference of 0.75%), French American Indian (13.7%, a difference of 0.81%), and Apache (13.7%, a difference of 0.93%).
| Demographics | Rating | Rank | Female Disability |
| Immigrants | Dominican Republic | 0.0 /100 | #299 | Tragic 13.4% |
| Pennsylvania Germans | 0.0 /100 | #300 | Tragic 13.4% |
| Africans | 0.0 /100 | #301 | Tragic 13.4% |
| Scotch-Irish | 0.0 /100 | #302 | Tragic 13.4% |
| Immigrants | Portugal | 0.0 /100 | #303 | Tragic 13.5% |
| Immigrants | Micronesia | 0.0 /100 | #304 | Tragic 13.5% |
| Dominicans | 0.0 /100 | #305 | Tragic 13.5% |
| French Canadians | 0.0 /100 | #306 | Tragic 13.6% |
| Central American Indians | 0.0 /100 | #307 | Tragic 13.6% |
| Cree | 0.0 /100 | #308 | Tragic 13.7% |
| French American Indians | 0.0 /100 | #309 | Tragic 13.7% |
| Apache | 0.0 /100 | #310 | Tragic 13.7% |
| Hopi | 0.0 /100 | #311 | Tragic 13.7% |
| Delaware | 0.0 /100 | #312 | Tragic 13.8% |
| Blackfeet | 0.0 /100 | #313 | Tragic 13.8% |
Demographics Similar to Immigrants from Western Europe by Female Disability
In terms of female disability, the demographic groups most similar to Immigrants from Western Europe are Immigrants from Ghana (12.2%, a difference of 0.060%), Immigrants from Guyana (12.2%, a difference of 0.080%), Immigrants from Fiji (12.3%, a difference of 0.11%), Albanian (12.3%, a difference of 0.12%), and Immigrants from Canada (12.3%, a difference of 0.15%).
| Demographics | Rating | Rank | Female Disability |
| Immigrants | Southern Europe | 56.3 /100 | #171 | Average 12.2% |
| Haitians | 51.9 /100 | #172 | Average 12.2% |
| Immigrants | Mexico | 50.8 /100 | #173 | Average 12.2% |
| Immigrants | England | 50.0 /100 | #174 | Average 12.2% |
| Immigrants | St. Vincent and the Grenadines | 49.7 /100 | #175 | Average 12.2% |
| Immigrants | Guyana | 43.1 /100 | #176 | Average 12.2% |
| Immigrants | Ghana | 42.5 /100 | #177 | Average 12.2% |
| Immigrants | Western Europe | 40.9 /100 | #178 | Average 12.2% |
| Immigrants | Fiji | 38.2 /100 | #179 | Fair 12.3% |
| Albanians | 37.9 /100 | #180 | Fair 12.3% |
| Immigrants | Canada | 37.2 /100 | #181 | Fair 12.3% |
| Norwegians | 36.9 /100 | #182 | Fair 12.3% |
| Cubans | 36.5 /100 | #183 | Fair 12.3% |
| Iraqis | 36.0 /100 | #184 | Fair 12.3% |
| Immigrants | Uzbekistan | 33.9 /100 | #185 | Fair 12.3% |