Immigrants from Middle Africa vs Norwegian Female Disability
COMPARE
Immigrants from Middle Africa
Norwegian
Female Disability
Female Disability Comparison
Immigrants from Middle Africa
Norwegians
12.1%
FEMALE DISABILITY
72.4/ 100
METRIC RATING
158th/ 347
METRIC RANK
12.3%
FEMALE DISABILITY
36.9/ 100
METRIC RATING
182nd/ 347
METRIC RANK
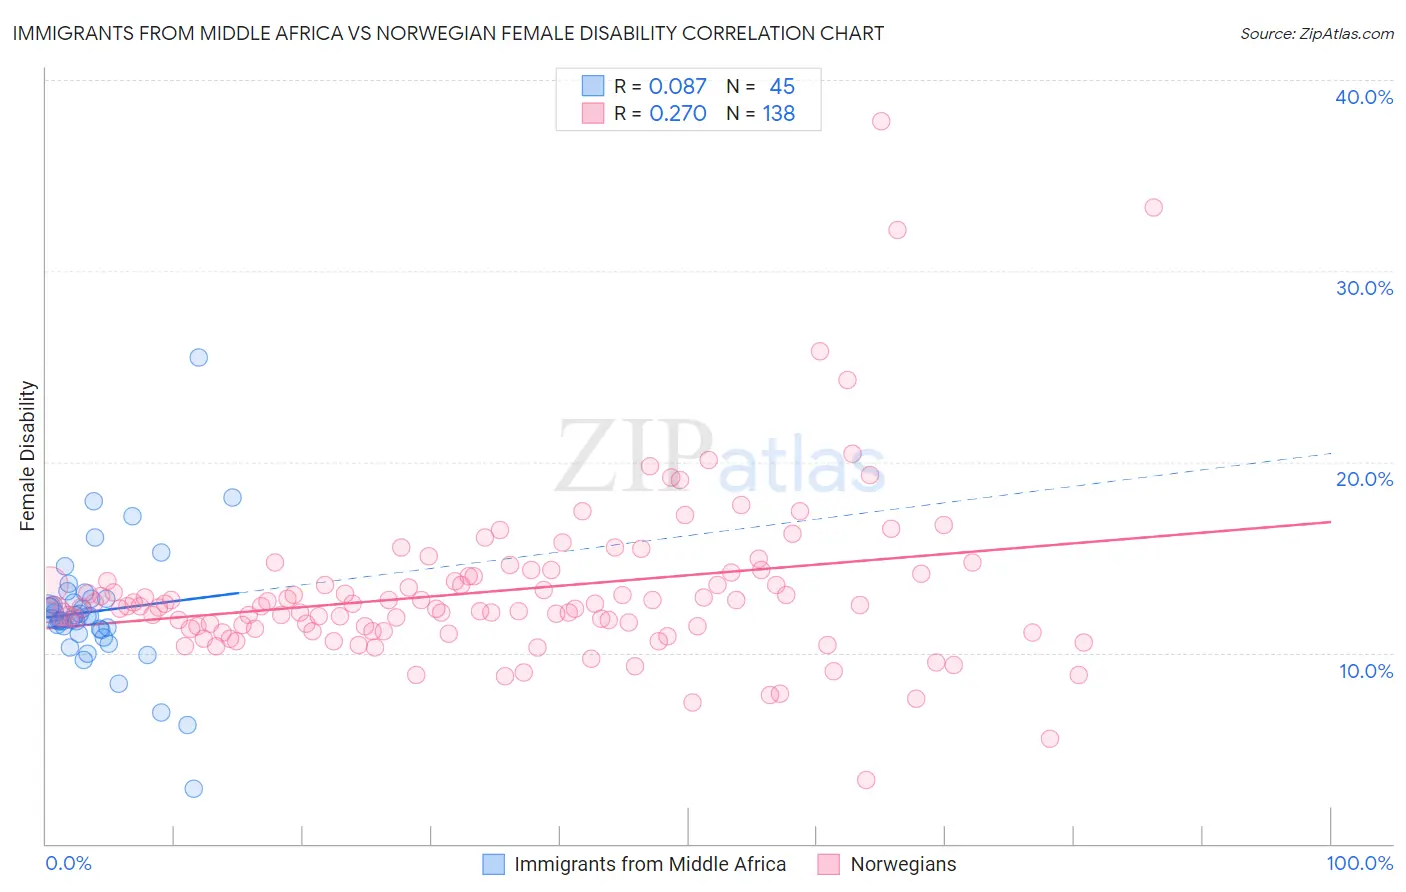
Immigrants from Middle Africa vs Norwegian Female Disability Correlation Chart
The statistical analysis conducted on geographies consisting of 202,716,278 people shows a slight positive correlation between the proportion of Immigrants from Middle Africa and percentage of females with a disability in the United States with a correlation coefficient (R) of 0.087 and weighted average of 12.1%. Similarly, the statistical analysis conducted on geographies consisting of 533,161,663 people shows a weak positive correlation between the proportion of Norwegians and percentage of females with a disability in the United States with a correlation coefficient (R) of 0.270 and weighted average of 12.3%, a difference of 1.4%.
Female Disability Correlation Summary
| Measurement | Immigrants from Middle Africa | Norwegian |
| Minimum | 2.9% | 3.3% |
| Maximum | 25.5% | 37.8% |
| Range | 22.6% | 34.5% |
| Mean | 12.2% | 13.3% |
| Median | 11.9% | 12.4% |
| Interquartile 25% (IQ1) | 11.1% | 11.3% |
| Interquartile 75% (IQ3) | 12.8% | 14.0% |
| Interquartile Range (IQR) | 1.7% | 2.8% |
| Standard Deviation (Sample) | 3.4% | 4.4% |
| Standard Deviation (Population) | 3.3% | 4.4% |
Similar Demographics by Female Disability
Demographics Similar to Immigrants from Middle Africa by Female Disability
In terms of female disability, the demographic groups most similar to Immigrants from Middle Africa are Danish (12.1%, a difference of 0.010%), Moroccan (12.1%, a difference of 0.020%), Ghanaian (12.1%, a difference of 0.21%), Immigrants from Central America (12.1%, a difference of 0.21%), and Syrian (12.1%, a difference of 0.23%).
| Demographics | Rating | Rank | Female Disability |
| Icelanders | 80.7 /100 | #151 | Excellent 12.0% |
| Immigrants | Scotland | 79.3 /100 | #152 | Good 12.0% |
| Sudanese | 79.1 /100 | #153 | Good 12.0% |
| Syrians | 76.9 /100 | #154 | Good 12.1% |
| Ghanaians | 76.6 /100 | #155 | Good 12.1% |
| Moroccans | 72.9 /100 | #156 | Good 12.1% |
| Danes | 72.5 /100 | #157 | Good 12.1% |
| Immigrants | Middle Africa | 72.4 /100 | #158 | Good 12.1% |
| Immigrants | Central America | 67.7 /100 | #159 | Good 12.1% |
| Immigrants | Guatemala | 66.0 /100 | #160 | Good 12.1% |
| Guyanese | 64.7 /100 | #161 | Good 12.1% |
| Immigrants | Ukraine | 64.3 /100 | #162 | Good 12.1% |
| Guatemalans | 63.8 /100 | #163 | Good 12.1% |
| Czechs | 63.6 /100 | #164 | Good 12.1% |
| Immigrants | Oceania | 61.8 /100 | #165 | Good 12.1% |
Demographics Similar to Norwegians by Female Disability
In terms of female disability, the demographic groups most similar to Norwegians are Immigrants from Canada (12.3%, a difference of 0.010%), Cuban (12.3%, a difference of 0.020%), Albanian (12.3%, a difference of 0.040%), Iraqi (12.3%, a difference of 0.040%), and Immigrants from Fiji (12.3%, a difference of 0.050%).
| Demographics | Rating | Rank | Female Disability |
| Immigrants | St. Vincent and the Grenadines | 49.7 /100 | #175 | Average 12.2% |
| Immigrants | Guyana | 43.1 /100 | #176 | Average 12.2% |
| Immigrants | Ghana | 42.5 /100 | #177 | Average 12.2% |
| Immigrants | Western Europe | 40.9 /100 | #178 | Average 12.2% |
| Immigrants | Fiji | 38.2 /100 | #179 | Fair 12.3% |
| Albanians | 37.9 /100 | #180 | Fair 12.3% |
| Immigrants | Canada | 37.2 /100 | #181 | Fair 12.3% |
| Norwegians | 36.9 /100 | #182 | Fair 12.3% |
| Cubans | 36.5 /100 | #183 | Fair 12.3% |
| Iraqis | 36.0 /100 | #184 | Fair 12.3% |
| Immigrants | Uzbekistan | 33.9 /100 | #185 | Fair 12.3% |
| Austrians | 33.3 /100 | #186 | Fair 12.3% |
| Serbians | 33.1 /100 | #187 | Fair 12.3% |
| Immigrants | North America | 32.8 /100 | #188 | Fair 12.3% |
| Immigrants | Albania | 31.6 /100 | #189 | Fair 12.3% |