Immigrants from Malaysia vs Vietnamese In Labor Force | Age 20-24
COMPARE
Immigrants from Malaysia
Vietnamese
In Labor Force | Age 20-24
In Labor Force | Age 20-24 Comparison
Immigrants from Malaysia
Vietnamese
73.3%
IN LABOR FORCE | AGE 20-24
0.2/ 100
METRIC RATING
277th/ 347
METRIC RANK
70.6%
IN LABOR FORCE | AGE 20-24
0.0/ 100
METRIC RATING
330th/ 347
METRIC RANK
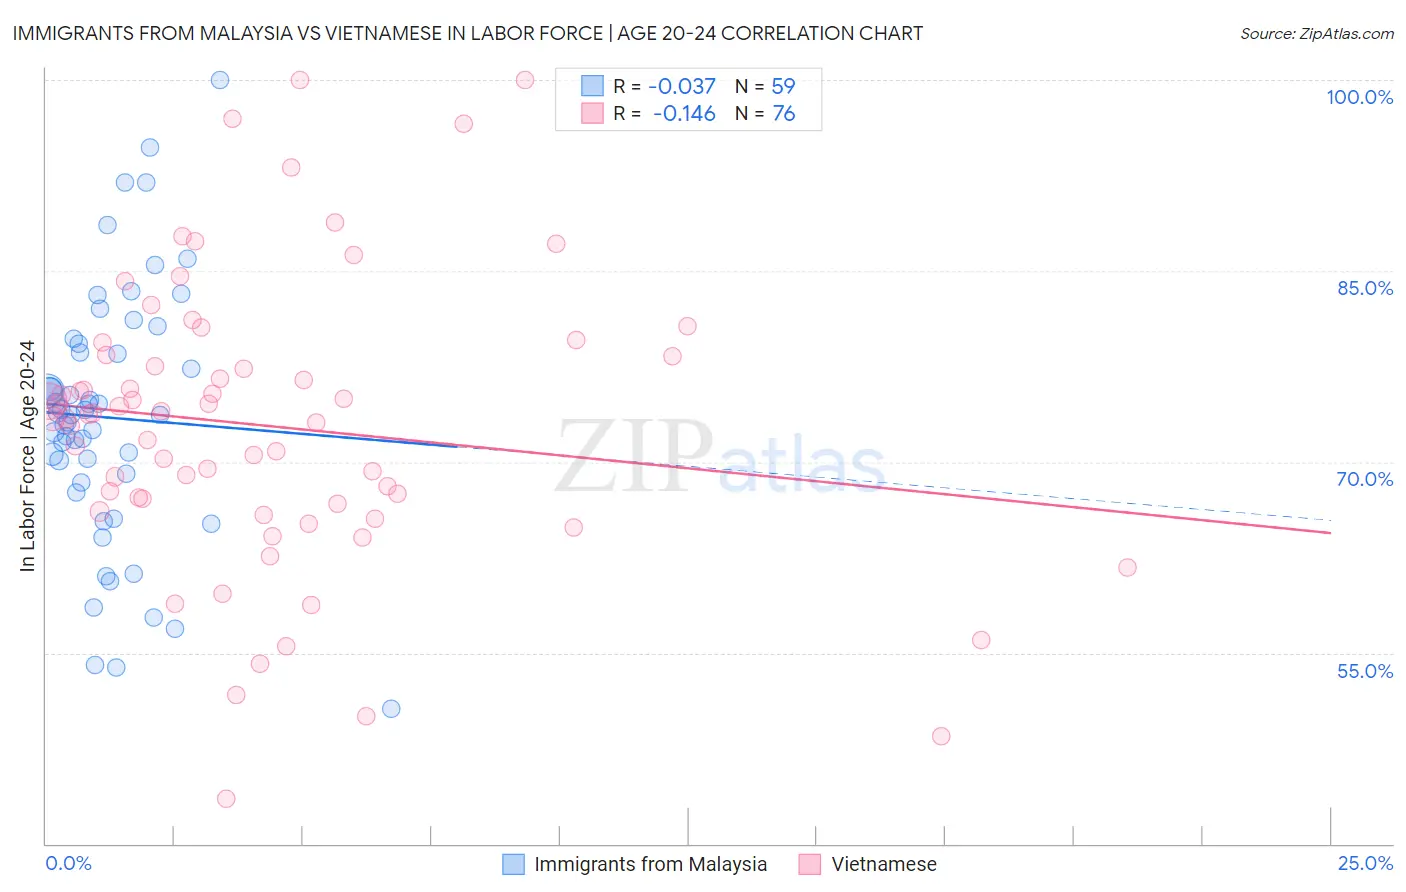
Immigrants from Malaysia vs Vietnamese In Labor Force | Age 20-24 Correlation Chart
The statistical analysis conducted on geographies consisting of 197,961,052 people shows no correlation between the proportion of Immigrants from Malaysia and labor force participation rate among population between the ages 20 and 24 in the United States with a correlation coefficient (R) of -0.037 and weighted average of 73.3%. Similarly, the statistical analysis conducted on geographies consisting of 170,753,724 people shows a poor negative correlation between the proportion of Vietnamese and labor force participation rate among population between the ages 20 and 24 in the United States with a correlation coefficient (R) of -0.146 and weighted average of 70.6%, a difference of 3.8%.
In Labor Force | Age 20-24 Correlation Summary
| Measurement | Immigrants from Malaysia | Vietnamese |
| Minimum | 50.6% | 43.5% |
| Maximum | 100.0% | 100.0% |
| Range | 49.4% | 56.5% |
| Mean | 73.5% | 72.8% |
| Median | 73.7% | 73.6% |
| Interquartile 25% (IQ1) | 68.4% | 66.4% |
| Interquartile 75% (IQ3) | 79.3% | 78.3% |
| Interquartile Range (IQR) | 11.0% | 11.9% |
| Standard Deviation (Sample) | 10.1% | 11.4% |
| Standard Deviation (Population) | 10.0% | 11.3% |
Similar Demographics by In Labor Force | Age 20-24
Demographics Similar to Immigrants from Malaysia by In Labor Force | Age 20-24
In terms of in labor force | age 20-24, the demographic groups most similar to Immigrants from Malaysia are Mongolian (73.3%, a difference of 0.010%), Immigrants from South America (73.3%, a difference of 0.020%), Cypriot (73.3%, a difference of 0.020%), Venezuelan (73.3%, a difference of 0.030%), and Immigrants from Colombia (73.4%, a difference of 0.070%).
| Demographics | Rating | Rank | In Labor Force | Age 20-24 |
| Immigrants | Russia | 0.3 /100 | #270 | Tragic 73.5% |
| Immigrants | Indonesia | 0.3 /100 | #271 | Tragic 73.4% |
| Belizeans | 0.3 /100 | #272 | Tragic 73.4% |
| Cheyenne | 0.2 /100 | #273 | Tragic 73.4% |
| Immigrants | Colombia | 0.2 /100 | #274 | Tragic 73.4% |
| Immigrants | South America | 0.2 /100 | #275 | Tragic 73.3% |
| Mongolians | 0.2 /100 | #276 | Tragic 73.3% |
| Immigrants | Malaysia | 0.2 /100 | #277 | Tragic 73.3% |
| Cypriots | 0.2 /100 | #278 | Tragic 73.3% |
| Venezuelans | 0.2 /100 | #279 | Tragic 73.3% |
| Bahamians | 0.1 /100 | #280 | Tragic 73.3% |
| Immigrants | Venezuela | 0.1 /100 | #281 | Tragic 73.2% |
| Immigrants | Spain | 0.1 /100 | #282 | Tragic 73.2% |
| Immigrants | Bahamas | 0.1 /100 | #283 | Tragic 73.2% |
| Kiowa | 0.1 /100 | #284 | Tragic 73.2% |
Demographics Similar to Vietnamese by In Labor Force | Age 20-24
In terms of in labor force | age 20-24, the demographic groups most similar to Vietnamese are Immigrants from Bangladesh (70.6%, a difference of 0.020%), Immigrants from Uzbekistan (70.4%, a difference of 0.33%), Yup'ik (70.9%, a difference of 0.35%), Yuman (70.3%, a difference of 0.55%), and Immigrants from China (71.1%, a difference of 0.59%).
| Demographics | Rating | Rank | In Labor Force | Age 20-24 |
| West Indians | 0.0 /100 | #323 | Tragic 71.3% |
| Immigrants | Dominican Republic | 0.0 /100 | #324 | Tragic 71.2% |
| Barbadians | 0.0 /100 | #325 | Tragic 71.1% |
| Dominicans | 0.0 /100 | #326 | Tragic 71.1% |
| Immigrants | Trinidad and Tobago | 0.0 /100 | #327 | Tragic 71.1% |
| Immigrants | China | 0.0 /100 | #328 | Tragic 71.1% |
| Yup'ik | 0.0 /100 | #329 | Tragic 70.9% |
| Vietnamese | 0.0 /100 | #330 | Tragic 70.6% |
| Immigrants | Bangladesh | 0.0 /100 | #331 | Tragic 70.6% |
| Immigrants | Uzbekistan | 0.0 /100 | #332 | Tragic 70.4% |
| Yuman | 0.0 /100 | #333 | Tragic 70.3% |
| British West Indians | 0.0 /100 | #334 | Tragic 70.0% |
| Immigrants | Barbados | 0.0 /100 | #335 | Tragic 69.7% |
| Immigrants | Guyana | 0.0 /100 | #336 | Tragic 69.3% |
| Guyanese | 0.0 /100 | #337 | Tragic 69.2% |