Immigrants from Malaysia vs Immigrants from Costa Rica Female Disability
COMPARE
Immigrants from Malaysia
Immigrants from Costa Rica
Female Disability
Female Disability Comparison
Immigrants from Malaysia
Immigrants from Costa Rica
11.1%
FEMALE DISABILITY
100.0/ 100
METRIC RATING
29th/ 347
METRIC RANK
11.7%
FEMALE DISABILITY
98.4/ 100
METRIC RATING
101st/ 347
METRIC RANK
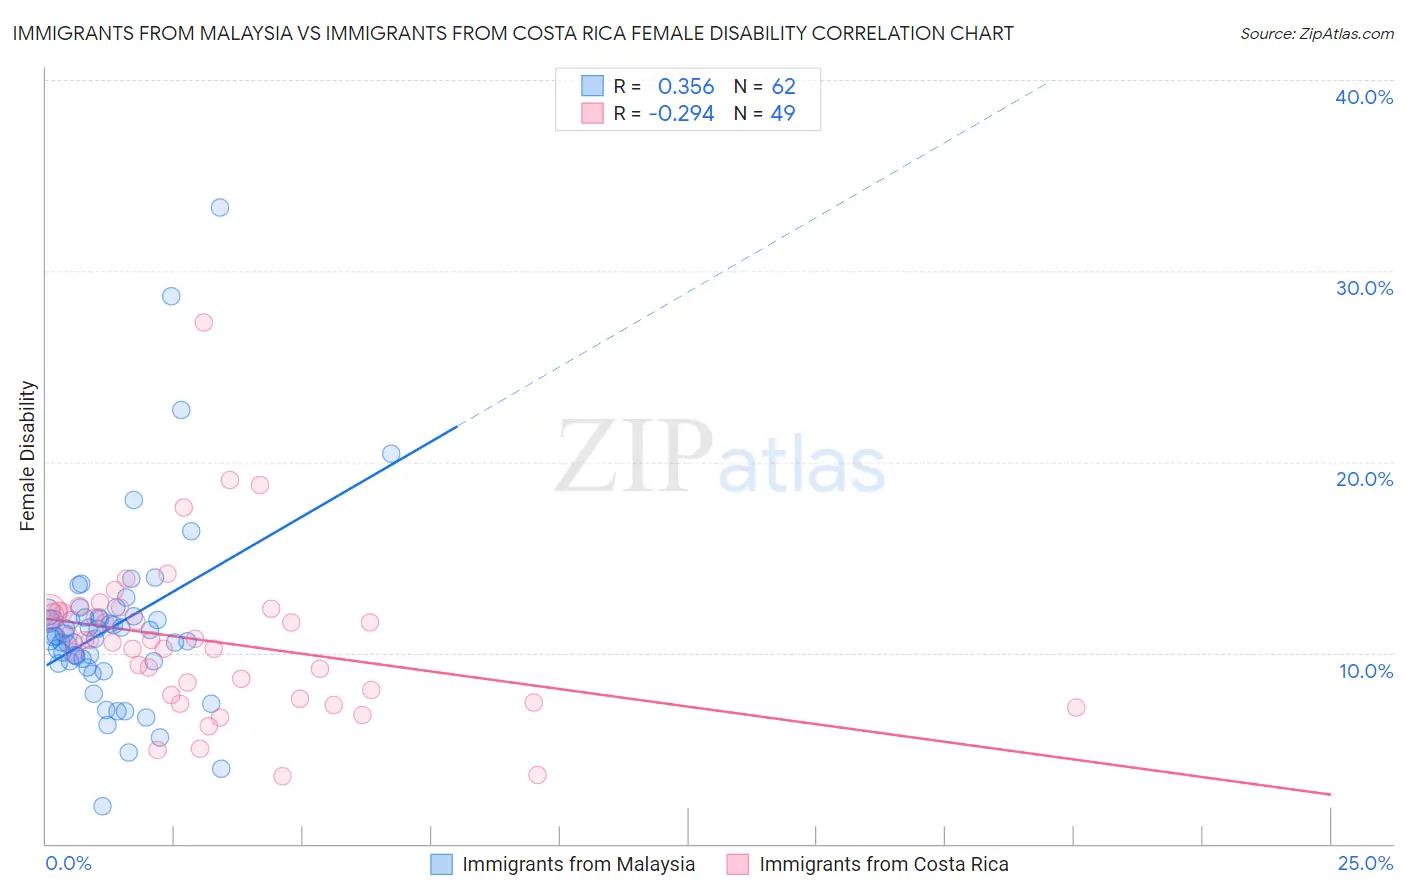
Immigrants from Malaysia vs Immigrants from Costa Rica Female Disability Correlation Chart
The statistical analysis conducted on geographies consisting of 197,971,207 people shows a mild positive correlation between the proportion of Immigrants from Malaysia and percentage of females with a disability in the United States with a correlation coefficient (R) of 0.356 and weighted average of 11.1%. Similarly, the statistical analysis conducted on geographies consisting of 204,259,041 people shows a weak negative correlation between the proportion of Immigrants from Costa Rica and percentage of females with a disability in the United States with a correlation coefficient (R) of -0.294 and weighted average of 11.7%, a difference of 5.6%.
Female Disability Correlation Summary
| Measurement | Immigrants from Malaysia | Immigrants from Costa Rica |
| Minimum | 1.9% | 3.5% |
| Maximum | 33.3% | 27.3% |
| Range | 31.4% | 23.7% |
| Mean | 11.4% | 10.6% |
| Median | 10.9% | 10.7% |
| Interquartile 25% (IQ1) | 9.5% | 7.7% |
| Interquartile 75% (IQ3) | 11.8% | 12.2% |
| Interquartile Range (IQR) | 2.3% | 4.5% |
| Standard Deviation (Sample) | 4.9% | 4.1% |
| Standard Deviation (Population) | 4.9% | 4.1% |
Similar Demographics by Female Disability
Demographics Similar to Immigrants from Malaysia by Female Disability
In terms of female disability, the demographic groups most similar to Immigrants from Malaysia are Turkish (11.1%, a difference of 0.0%), Egyptian (11.1%, a difference of 0.060%), Immigrants from Kuwait (11.1%, a difference of 0.10%), Immigrants from Australia (11.1%, a difference of 0.27%), and Immigrants from Turkey (11.1%, a difference of 0.34%).
| Demographics | Rating | Rank | Female Disability |
| Immigrants | Sri Lanka | 100.0 /100 | #22 | Exceptional 10.9% |
| Venezuelans | 100.0 /100 | #23 | Exceptional 11.0% |
| Immigrants | Argentina | 100.0 /100 | #24 | Exceptional 11.0% |
| Immigrants | Asia | 100.0 /100 | #25 | Exceptional 11.0% |
| Argentineans | 100.0 /100 | #26 | Exceptional 11.0% |
| Immigrants | Turkey | 100.0 /100 | #27 | Exceptional 11.1% |
| Egyptians | 100.0 /100 | #28 | Exceptional 11.1% |
| Immigrants | Malaysia | 100.0 /100 | #29 | Exceptional 11.1% |
| Turks | 100.0 /100 | #30 | Exceptional 11.1% |
| Immigrants | Kuwait | 100.0 /100 | #31 | Exceptional 11.1% |
| Immigrants | Australia | 100.0 /100 | #32 | Exceptional 11.1% |
| Immigrants | Egypt | 100.0 /100 | #33 | Exceptional 11.1% |
| Immigrants | Indonesia | 100.0 /100 | #34 | Exceptional 11.2% |
| Immigrants | Japan | 100.0 /100 | #35 | Exceptional 11.2% |
| Cypriots | 100.0 /100 | #36 | Exceptional 11.2% |
Demographics Similar to Immigrants from Costa Rica by Female Disability
In terms of female disability, the demographic groups most similar to Immigrants from Costa Rica are Immigrants from South Eastern Asia (11.7%, a difference of 0.010%), Immigrants from Uruguay (11.7%, a difference of 0.020%), Immigrants from Philippines (11.7%, a difference of 0.070%), Immigrants from Eastern Africa (11.7%, a difference of 0.080%), and Immigrants from Western Asia (11.7%, a difference of 0.090%).
| Demographics | Rating | Rank | Female Disability |
| Immigrants | Brazil | 99.4 /100 | #94 | Exceptional 11.6% |
| Immigrants | Northern Europe | 99.4 /100 | #95 | Exceptional 11.6% |
| Immigrants | Russia | 99.0 /100 | #96 | Exceptional 11.7% |
| Koreans | 99.0 /100 | #97 | Exceptional 11.7% |
| Uruguayans | 98.8 /100 | #98 | Exceptional 11.7% |
| Immigrants | Philippines | 98.6 /100 | #99 | Exceptional 11.7% |
| Immigrants | Uruguay | 98.5 /100 | #100 | Exceptional 11.7% |
| Immigrants | Costa Rica | 98.4 /100 | #101 | Exceptional 11.7% |
| Immigrants | South Eastern Asia | 98.4 /100 | #102 | Exceptional 11.7% |
| Immigrants | Eastern Africa | 98.3 /100 | #103 | Exceptional 11.7% |
| Immigrants | Western Asia | 98.3 /100 | #104 | Exceptional 11.7% |
| Australians | 98.3 /100 | #105 | Exceptional 11.7% |
| Immigrants | Greece | 98.2 /100 | #106 | Exceptional 11.7% |
| Latvians | 98.2 /100 | #107 | Exceptional 11.7% |
| New Zealanders | 98.1 /100 | #108 | Exceptional 11.7% |